¶ 19

Node info and management

¶ 19.1

Node status

STATUS

The easiest way to view high-level information about your Manticore node is by running status in the MySQL client. It will display information about various aspects, such as:

SQL
mysql> status
--------------
mysql  Ver 14.14 Distrib 5.7.30, for Linux (x86_64) using  EditLine wrapper

Connection id:      378
Current database:   Manticore
Current user:       Usual
SSL:            Not in use
Current pager:      stdout
Using outfile:      ''
Using delimiter:    ;
Server version:     3.4.3 a48c61d6@200702 coroutines git branch coroutines_work_junk...origin/coroutines_work_junk
Protocol version:   10
Connection:     0 via TCP/IP
Server characterset:
Db     characterset:
Client characterset:    utf8
Conn.  characterset:    utf8
TCP port:       8306
Uptime:         23 hours 6 sec

Threads: 12  Queue: 3  Clients: 1  Vip clients: 0  Tasks: 5  Queries: 318967  Wall: 7h  CPU: 0us
Queue/Th: 0.2  Tasks/Th: 0.4
--------------

SHOW STATUS

SHOW STATUS [ LIKE pattern ]

SHOW STATUS is an SQL statement that presents various helpful performance counters. IO and CPU counters will only be available if searchd was started with the --iostats and --cpustats switches, respectively (or if they were enabled via SET GLOBAL iostats/cpustats=1).

SQL
SHOW STATUS;
+-----------------------+---------------------------+
| Counter               | Value                     |
+-----------------------+---------------------------+
| uptime                | 1385                      |
| connections           | 11                        |
| maxed_out             | 0                         |
| version               | 3.4.3 ab7cbe5d@200511 dev |
| mysql_version         | 3.4.3 ab7cbe5d@200511 dev |
| command_search        | 2                         |
| command_excerpt       | 0                         |
| command_update        | 0                         |
| command_delete        | 0                         |
| command_keywords      | 0                         |
| command_persist       | 0                         |
| command_status        | 1                         |
| command_flushattrs    | 0                         |
| command_set           | 1                         |
| command_insert        | 0                         |
| command_replace       | 0                         |
| command_commit        | 0                         |
| command_suggest       | 0                         |
| command_json          | 0                         |
| command_callpq        | 0                         |
| agent_connect         | 0                         |
| agent_retry           | 0                         |
| queries               | 12                        |
| dist_queries          | 0                         |
| workers_total         | 30                        |
| workers_active        | 1                         |
| workers_clients       | 0                         |
| workers_clients_vip   | 1                         |
| work_queue_length     | 1                         |
| query_wall            | 10.805                    |
| query_cpu             | OFF                       |
| dist_wall             | 0.000                     |
| dist_local            | 0.000                     |
| dist_wait             | 0.000                     |
| query_reads           | OFF                       |
| query_readkb          | OFF                       |
| query_readtime        | OFF                       |
| avg_query_wall        | 0.900                     |
| avg_query_cpu         | OFF                       |
| avg_dist_wall         | 0.000                     |
| avg_dist_local        | 0.000                     |
| avg_dist_wait         | 0.000                     |
| avg_query_reads       | OFF                       |
| avg_query_readkb      | OFF                       |
| avg_query_readtime    | OFF                       |
| qcache_max_bytes      | 0                         |
| qcache_thresh_msec    | 3000                      |
| qcache_ttl_sec        | 60                        |
| qcache_cached_queries | 0                         |
| qcache_used_bytes     | 0                         |
| qcache_hits           | 0                         |
+-----------------------+---------------------------+
49 rows in set (0.00 sec)

An optional LIKE clause is supported, allowing you to select only the variables that match a specific pattern. The pattern syntax follows standard SQL wildcards, where % represents any number of any characters, and _ represents a single character.

SQL
SHOW STATUS LIKE 'qcache%';
+-----------------------+-------+
| Counter               | Value |
+-----------------------+-------+
| qcache_max_bytes      | 0     |
| qcache_thresh_msec    | 3000  |
| qcache_ttl_sec        | 60    |
| qcache_cached_queries | 0     |
| qcache_used_bytes     | 0     |
| qcache_hits           | 0     |
+-----------------------+-------+
6 rows in set (0.00 sec)

SHOW SETTINGS

SHOW SETTINGS is an SQL statement that displays the current settings from your configuration file. The setting names are represented in the following format: 'config_section_name'.'setting_name'

The result also includes two additional values:
- configuration_file - The path to the configuration file
- worker_pid - The process ID of the running searchd instance

SQL
SHOW SETTINGS;
+--------------------------+-------------------------------------+
| Setting_name             | Value                               |
+--------------------------+-------------------------------------+
| configuration_file       | /etc/manticoresearch/manticore.conf |
| worker_pid               | 658                                 |
| searchd.listen           | 0.0.0:9312                          |
| searchd.listen           | 0.0.0:9306:mysql                    |
| searchd.listen           | 0.0.0:9308:http                     |
| searchd.log              | /var/log/manticore/searchd.log      |
| searchd.query_log        | /var/log/manticore/query.log        |
| searchd.pid_file         | /var/run/manticore/searchd.pid      |
| searchd.data_dir         | /var/lib/manticore                  |
| searchd.query_log_format | sphinxql                            |
| searchd.binlog_path      | /var/lib/manticore/binlog           |
| common.plugin_dir        | /usr/local/lib/manticore            |
| common.lemmatizer_base   | /usr/share/manticore/morph/         |
+--------------------------+-------------------------------------+
13 rows in set (0.00 sec)

SHOW AGENT STATUS

SHOW AGENT ['agent_or_index'] STATUS [ LIKE pattern ]

SHOW AGENT STATUS displays the statistics of remote agents or a distributed table. It includes values such as the age of the last request, last answer, the number of various types of errors and successes, and so on. Statistics are displayed for every agent for the last 1, 5, and 15 intervals, each consisting of ha_period_karma seconds.

SQL
SHOW AGENT STATUS;
+------------------------------------+----------------------------+
| Variable_name                      | Value                      |
+------------------------------------+----------------------------+
| status_period_seconds              | 60                         |
| status_stored_periods              | 15                         |
| ag_0_hostname                      | 192.168.0.202:6713         |
| ag_0_references                    | 2                          |
| ag_0_lastquery                     | 0.41                       |
| ag_0_lastanswer                    | 0.19                       |
| ag_0_lastperiodmsec                | 222                        |
| ag_0_pingtripmsec                  | 10.521                     |
| ag_0_errorsarow                    | 0                          |
| ag_0_1periods_query_timeouts       | 0                          |
| ag_0_1periods_connect_timeouts     | 0                          |
| ag_0_1periods_connect_failures     | 0                          |
| ag_0_1periods_network_errors       | 0                          |
| ag_0_1periods_wrong_replies        | 0                          |
| ag_0_1periods_unexpected_closings  | 0                          |
| ag_0_1periods_warnings             | 0                          |
| ag_0_1periods_succeeded_queries    | 27                         |
| ag_0_1periods_msecsperquery        | 232.31                     |
| ag_0_5periods_query_timeouts       | 0                          |
| ag_0_5periods_connect_timeouts     | 0                          |
| ag_0_5periods_connect_failures     | 0                          |
| ag_0_5periods_network_errors       | 0                          |
| ag_0_5periods_wrong_replies        | 0                          |
| ag_0_5periods_unexpected_closings  | 0                          |
| ag_0_5periods_warnings             | 0                          |
| ag_0_5periods_succeeded_queries    | 146                        |
| ag_0_5periods_msecsperquery        | 231.83                     |
| ag_1_hostname                      | 192.168.0.202:6714         |
| ag_1_references                    | 2                          |
| ag_1_lastquery                     | 0.41                       |
| ag_1_lastanswer                    | 0.19                       |
| ag_1_lastperiodmsec                | 220                        |
| ag_1_pingtripmsec                  | 10.004                     |
| ag_1_errorsarow                    | 0                          |
| ag_1_1periods_query_timeouts       | 0                          |
| ag_1_1periods_connect_timeouts     | 0                          |
| ag_1_1periods_connect_failures     | 0                          |
| ag_1_1periods_network_errors       | 0                          |
| ag_1_1periods_wrong_replies        | 0                          |
| ag_1_1periods_unexpected_closings  | 0                          |
| ag_1_1periods_warnings             | 0                          |
| ag_1_1periods_succeeded_queries    | 27                         |
| ag_1_1periods_msecsperquery        | 231.24                     |
| ag_1_5periods_query_timeouts       | 0                          |
| ag_1_5periods_connect_timeouts     | 0                          |
| ag_1_5periods_connect_failures     | 0                          |
| ag_1_5periods_network_errors       | 0                          |
| ag_1_5periods_wrong_replies        | 0                          |
| ag_1_5periods_unexpected_closings  | 0                          |
| ag_1_5periods_warnings             | 0                          |
| ag_1_5periods_succeeded_queries    | 146                        |
| ag_1_5periods_msecsperquery        | 230.85                     |
+------------------------------------+----------------------------+
50 rows in set (0.01 sec)
PHP
$client->nodes()->agentstatus();
Array(
    [status_period_seconds] => 60
    [status_stored_periods] => 15
    [ag_0_hostname] => 192.168.0.202:6713
    [ag_0_references] => 2
    [ag_0_lastquery] => 0.41
    [ag_0_lastanswer] => 0.19
    [ag_0_lastperiodmsec] => 222  
    [ag_0_errorsarow] => 0
    [ag_0_1periods_query_timeouts] => 0
    [ag_0_1periods_connect_timeouts] => 0
    [ag_0_1periods_connect_failures] => 0
    [ag_0_1periods_network_errors] => 0
    [ag_0_1periods_wrong_replies] => 0
    [ag_0_1periods_unexpected_closings] => 0
    [ag_0_1periods_warnings] => 0
    [ag_0_1periods_succeeded_queries] => 27
    [ag_0_1periods_msecsperquery] => 232.31
    [ag_0_5periods_query_timeouts] => 0
    [ag_0_5periods_connect_timeouts] => 0
    [ag_0_5periods_connect_failures] => 0
    [ag_0_5periods_network_errors] => 0
    [ag_0_5periods_wrong_replies] => 0
    [ag_0_5periods_unexpected_closings] => 0
    [ag_0_5periods_warnings] => 0
    [ag_0_5periods_succeeded_queries] => 146  
    [ag_0_5periods_msecsperquery] => 231.83
    [ag_1_hostname 192.168.0.202:6714
    [ag_1_references] => 2
    [ag_1_lastquery] => 0.41
    [ag_1_lastanswer] => 0.19
    [ag_1_lastperiodmsec] => 220  
    [ag_1_errorsarow] => 0
    [ag_1_1periods_query_timeouts] => 0
    [ag_1_1periods_connect_timeouts] => 0
    [ag_1_1periods_connect_failures] => 0
    [ag_1_1periods_network_errors] => 0
    [ag_1_1periods_wrong_replies] => 0
    [ag_1_1periods_unexpected_closings] => 0
    [ag_1_1periods_warnings] => 0
    [ag_1_1periods_succeeded_queries] => 27
    [ag_1_1periods_msecsperquery] => 231.24
    [ag_1_5periods_query_timeouts] => 0
    [ag_1_5periods_connect_timeouts] => 0
    [ag_1_5periods_connect_failures] => 0
    [ag_1_5periods_network_errors] => 0
    [ag_1_5periods_wrong_replies] => 0
    [ag_1_5periods_unexpected_closings
    [ag_1_5periods_warnings] => 0
    [ag_1_5periods_succeeded_queries] => 146  
    [ag_1_5periods_msecsperquery] => 230.85
)
Python
utilsApi.sql('SHOW AGENT STATUS')
{u'columns': [{u'Key': {u'type': u'string'}},
              {u'Value': {u'type': u'string'}}],
 u'data': [
    {u'Key': u'status_period_seconds', u'Value': u'60'},
    {u'Key': u'status_stored_periods', u'Value': u'15'},
    {u'Key': u'ag_0_hostname', u'Value': u'192.168.0.202:6713'},
    {u'Key': u'ag_0_references', u'Value': u'2'},
    {u'Key': u'ag_0_lastquery', u'Value': u'0.41'},
    {u'Key': u'ag_0_lastanswer', u'Value': u'0.19'},
    {u'Key': u'ag_0_lastperiodmsec', u'Value': u'222'},
    {u'Key': u'ag_0_errorsarow', u'Value': u'0'},
    {u'Key': u'ag_0_1periods_query_timeouts', u'Value': u'0'},
    {u'Key': u'ag_0_1periods_connect_timeouts', u'Value': u'0'},
    {u'Key': u'ag_0_1periods_connect_failures', u'Value': u'0'},
    {u'Key': u'ag_0_1periods_network_errors', u'Value': u'0'},
    {u'Key': u'ag_0_1periods_wrong_replies', u'Value': u'0'},
    {u'Key': u'ag_0_1periods_unexpected_closings', u'Value': u'0'},
    {u'Key': u'ag_0_1periods_warnings', u'Value': u'0'},
    {u'Key': u'ag_0_1periods_succeeded_queries', u'Value': u'27'},
    {u'Key': u'ag_0_1periods_msecsperquery', u'Value': u'232.31'},
    {u'Key': u'ag_0_5periods_query_timeouts', u'Value': u'0'},
    {u'Key': u'ag_0_5periods_connect_timeouts', u'Value': u'0'},
    {u'Key': u'ag_0_5periods_connect_failures', u'Value': u'0'},
    {u'Key': u'ag_0_5periods_network_errors', u'Value': u'0'},
    {u'Key': u'ag_0_5periods_wrong_replies', u'Value': u'0'},
    {u'Key': u'ag_0_5periods_unexpected_closings', u'Value': u'0'},
    {u'Key': u'ag_0_5periods_warnings', u'Value': u'0'},
    {u'Key': u'ag_0_5periods_succeeded_queries', u'Value': u'146'},
    {u'Key': u'ag_0_5periods_msecsperquery', u'Value': u'231.83'},
    {u'Key': u'ag_1_hostname 192.168.0.202:6714'},
    {u'Key': u'ag_1_references', u'Value': u'2'},
    {u'Key': u'ag_1_lastquery', u'Value': u'0.41'},
    {u'Key': u'ag_1_lastanswer', u'Value': u'0.19'},
    {u'Key': u'ag_1_lastperiodmsec', u'Value': u'220'},
    {u'Key': u'ag_1_errorsarow', u'Value': u'0'},
    {u'Key': u'ag_1_1periods_query_timeouts', u'Value': u'0'},
    {u'Key': u'ag_1_1periods_connect_timeouts', u'Value': u'0'},
    {u'Key': u'ag_1_1periods_connect_failures', u'Value': u'0'},
    {u'Key': u'ag_1_1periods_network_errors', u'Value': u'0'},
    {u'Key': u'ag_1_1periods_wrong_replies', u'Value': u'0'},
    {u'Key': u'ag_1_1periods_unexpected_closings', u'Value': u'0'},
    {u'Key': u'ag_1_1periods_warnings', u'Value': u'0'},
    {u'Key': u'ag_1_1periods_succeeded_queries', u'Value': u'27'},
    {u'Key': u'ag_1_1periods_msecsperquery', u'Value': u'231.24'},
    {u'Key': u'ag_1_5periods_query_timeouts', u'Value': u'0'},
    {u'Key': u'ag_1_5periods_connect_timeouts', u'Value': u'0'},
    {u'Key': u'ag_1_5periods_connect_failures', u'Value': u'0'},
    {u'Key': u'ag_1_5periods_network_errors', u'Value': u'0'},
    {u'Key': u'ag_1_5periods_wrong_replies', u'Value': u'0'},
    {u'Key': u'ag_1_5periods_warnings', u'Value': u'0'},
    {u'Key': u'ag_1_5periods_succeeded_queries', u'Value': u'146'},
    {u'Key': u'ag_1_5periods_msecsperquery', u'Value': u'230.85'}],
 u'error': u'',
 u'total': 0,
 u'warning': u''}
javascript
res = await utilsApi.sql("SHOW AGENT STATUS");
{"columns": [{"Key": {"type": "string"}},
              {"Value": {"type": "string"}}],
 "data": [
    {"Key": "status_period_seconds", "Value": "60"},
    {"Key": "status_stored_periods", "Value": "15"},
    {"Key": "ag_0_hostname", "Value": "192.168.0.202:6713"},
    {"Key": "ag_0_references", "Value": "2"},
    {"Key": "ag_0_lastquery", "Value": "0.41"},
    {"Key": "ag_0_lastanswer", "Value": "0.19"},
    {"Key": "ag_0_lastperiodmsec", "Value": "222"},
    {"Key": "ag_0_errorsarow", "Value": "0"},
    {"Key": "ag_0_1periods_query_timeouts", "Value": "0"},
    {"Key": "ag_0_1periods_connect_timeouts", "Value": "0"},
    {"Key": "ag_0_1periods_connect_failures", "Value": "0"},
    {"Key": "ag_0_1periods_network_errors", "Value": "0"},
    {"Key": "ag_0_1periods_wrong_replies", "Value": "0"},
    {"Key": "ag_0_1periods_unexpected_closings", "Value": "0"},
    {"Key": "ag_0_1periods_warnings", "Value": "0"},
    {"Key": "ag_0_1periods_succeeded_queries", "Value": "27"},
    {"Key": "ag_0_1periods_msecsperquery", "Value": "232.31"},
    {"Key": "ag_0_5periods_query_timeouts", "Value": "0"},
    {"Key": "ag_0_5periods_connect_timeouts", "Value": "0"},
    {"Key": "ag_0_5periods_connect_failures", "Value": "0"},
    {"Key": "ag_0_5periods_network_errors", "Value": "0"},
    {"Key": "ag_0_5periods_wrong_replies", "Value": "0"},
    {"Key": "ag_0_5periods_unexpected_closings", "Value": "0"},
    {"Key": "ag_0_5periods_warnings", "Value": "0"},
    {"Key": "ag_0_5periods_succeeded_queries", "Value": "146"},
    {"Key": "ag_0_5periods_msecsperquery", "Value": "231.83"},
    {"Key": "ag_1_hostname 192.168.0.202:6714"},
    {"Key": "ag_1_references", "Value": "2"},
    {"Key": "ag_1_lastquery", "Value": "0.41"},
    {"Key": "ag_1_lastanswer", "Value": "0.19"},
    {"Key": "ag_1_lastperiodmsec", "Value": "220"},
    {"Key": "ag_1_errorsarow", "Value": "0"},
    {"Key": "ag_1_1periods_query_timeouts", "Value": "0"},
    {"Key": "ag_1_1periods_connect_timeouts", "Value": "0"},
    {"Key": "ag_1_1periods_connect_failures", "Value": "0"},
    {"Key": "ag_1_1periods_network_errors", "Value": "0"},
    {"Key": "ag_1_1periods_wrong_replies", "Value": "0"},
    {"Key": "ag_1_1periods_unexpected_closings", "Value": "0"},
    {"Key": "ag_1_1periods_warnings", "Value": "0"},
    {"Key": "ag_1_1periods_succeeded_queries", "Value": "27"},
    {"Key": "ag_1_1periods_msecsperquery", "Value": "231.24"},
    {"Key": "ag_1_5periods_query_timeouts", "Value": "0"},
    {"Key": "ag_1_5periods_connect_timeouts", "Value": "0"},
    {"Key": "ag_1_5periods_connect_failures", "Value": "0"},
    {"Key": "ag_1_5periods_network_errors", "Value": "0"},
    {"Key": "ag_1_5periods_wrong_replies", "Value": "0"},
    {"Key": "ag_1_5periods_warnings", "Value": "0"},
    {"Key": "ag_1_5periods_succeeded_queries", "Value": "146"},
    {"Key": "ag_1_5periods_msecsperquery", "Value": "230.85"}],
 "error": "",
 "total": 0,
 "warning": ""}
Java
utilsApi.sql("SHOW AGENT STATUS");
{columns=[{ Key : { type=string }},
              { Value : { type=string }}],
  data : [
    { Key=status_period_seconds ,  Value=60 },
    { Key=status_stored_periods ,  Value=15 },
    { Key=ag_0_hostname ,  Value=192.168.0.202:6713 },
    { Key=ag_0_references ,  Value=2 },
    { Key=ag_0_lastquery ,  Value=0.41 },
    { Key=ag_0_lastanswer ,  Value=0.19 },
    { Key=ag_0_lastperiodmsec ,  Value=222 },
    { Key=ag_0_errorsarow ,  Value=0 },
    { Key=ag_0_1periods_query_timeouts ,  Value=0 },
    { Key=ag_0_1periods_connect_timeouts ,  Value=0 },
    { Key=ag_0_1periods_connect_failures ,  Value=0 },
    { Key=ag_0_1periods_network_errors ,  Value=0 },
    { Key=ag_0_1periods_wrong_replies ,  Value=0 },
    { Key=ag_0_1periods_unexpected_closings ,  Value=0 },
    { Key=ag_0_1periods_warnings ,  Value=0 },
    { Key=ag_0_1periods_succeeded_queries ,  Value=27 },
    { Key=ag_0_1periods_msecsperquery ,  Value=232.31 },
    { Key=ag_0_5periods_query_timeouts ,  Value=0 },
    { Key=ag_0_5periods_connect_timeouts ,  Value=0 },
    { Key=ag_0_5periods_connect_failures ,  Value=0 },
    { Key=ag_0_5periods_network_errors ,  Value=0 },
    { Key=ag_0_5periods_wrong_replies ,  Value=0 },
    { Key=ag_0_5periods_unexpected_closings ,  Value=0 },
    { Key=ag_0_5periods_warnings ,  Value=0 },
    { Key=ag_0_5periods_succeeded_queries ,  Value=146 },
    { Key=ag_0_5periods_msecsperquery ,  Value=231.83 },
    { Key=ag_1_hostname 192.168.0.202:6714 },
    { Key=ag_1_references ,  Value=2 },
    { Key=ag_1_lastquery ,  Value=0.41 },
    { Key=ag_1_lastanswer ,  Value=0.19 },
    { Key=ag_1_lastperiodmsec ,  Value=220 },
    { Key=ag_1_errorsarow ,  Value=0 },
    { Key=ag_1_1periods_query_timeouts ,  Value=0 },
    { Key=ag_1_1periods_connect_timeouts ,  Value=0 },
    { Key=ag_1_1periods_connect_failures ,  Value=0 },
    { Key=ag_1_1periods_network_errors ,  Value=0 },
    { Key=ag_1_1periods_wrong_replies ,  Value=0 },
    { Key=ag_1_1periods_unexpected_closings ,  Value=0 },
    { Key=ag_1_1periods_warnings ,  Value=0 },
    { Key=ag_1_1periods_succeeded_queries ,  Value=27 },
    { Key=ag_1_1periods_msecsperquery ,  Value=231.24 },
    { Key=ag_1_5periods_query_timeouts ,  Value=0 },
    { Key=ag_1_5periods_connect_timeouts ,  Value=0 },
    { Key=ag_1_5periods_connect_failures ,  Value=0 },
    { Key=ag_1_5periods_network_errors ,  Value=0 },
    { Key=ag_1_5periods_wrong_replies ,  Value=0 },
    { Key=ag_1_5periods_warnings ,  Value=0 },
    { Key=ag_1_5periods_succeeded_queries ,  Value=146 },
    { Key=ag_1_5periods_msecsperquery ,  Value=230.85 }],
  error= ,
  total=0,
  warning= }
C#
utilsApi.Sql("SHOW AGENT STATUS");
{columns=[{ Key : { type=string }},
              { Value : { type=string }}],
  data : [
    { Key=status_period_seconds ,  Value=60 },
    { Key=status_stored_periods ,  Value=15 },
    { Key=ag_0_hostname ,  Value=192.168.0.202:6713 },
    { Key=ag_0_references ,  Value=2 },
    { Key=ag_0_lastquery ,  Value=0.41 },
    { Key=ag_0_lastanswer ,  Value=0.19 },
    { Key=ag_0_lastperiodmsec ,  Value=222 },
    { Key=ag_0_errorsarow ,  Value=0 },
    { Key=ag_0_1periods_query_timeouts ,  Value=0 },
    { Key=ag_0_1periods_connect_timeouts ,  Value=0 },
    { Key=ag_0_1periods_connect_failures ,  Value=0 },
    { Key=ag_0_1periods_network_errors ,  Value=0 },
    { Key=ag_0_1periods_wrong_replies ,  Value=0 },
    { Key=ag_0_1periods_unexpected_closings ,  Value=0 },
    { Key=ag_0_1periods_warnings ,  Value=0 },
    { Key=ag_0_1periods_succeeded_queries ,  Value=27 },
    { Key=ag_0_1periods_msecsperquery ,  Value=232.31 },
    { Key=ag_0_5periods_query_timeouts ,  Value=0 },
    { Key=ag_0_5periods_connect_timeouts ,  Value=0 },
    { Key=ag_0_5periods_connect_failures ,  Value=0 },
    { Key=ag_0_5periods_network_errors ,  Value=0 },
    { Key=ag_0_5periods_wrong_replies ,  Value=0 },
    { Key=ag_0_5periods_unexpected_closings ,  Value=0 },
    { Key=ag_0_5periods_warnings ,  Value=0 },
    { Key=ag_0_5periods_succeeded_queries ,  Value=146 },
    { Key=ag_0_5periods_msecsperquery ,  Value=231.83 },
    { Key=ag_1_hostname 192.168.0.202:6714 },
    { Key=ag_1_references ,  Value=2 },
    { Key=ag_1_lastquery ,  Value=0.41 },
    { Key=ag_1_lastanswer ,  Value=0.19 },
    { Key=ag_1_lastperiodmsec ,  Value=220 },
    { Key=ag_1_errorsarow ,  Value=0 },
    { Key=ag_1_1periods_query_timeouts ,  Value=0 },
    { Key=ag_1_1periods_connect_timeouts ,  Value=0 },
    { Key=ag_1_1periods_connect_failures ,  Value=0 },
    { Key=ag_1_1periods_network_errors ,  Value=0 },
    { Key=ag_1_1periods_wrong_replies ,  Value=0 },
    { Key=ag_1_1periods_unexpected_closings ,  Value=0 },
    { Key=ag_1_1periods_warnings ,  Value=0 },
    { Key=ag_1_1periods_succeeded_queries ,  Value=27 },
    { Key=ag_1_1periods_msecsperquery ,  Value=231.24 },
    { Key=ag_1_5periods_query_timeouts ,  Value=0 },
    { Key=ag_1_5periods_connect_timeouts ,  Value=0 },
    { Key=ag_1_5periods_connect_failures ,  Value=0 },
    { Key=ag_1_5periods_network_errors ,  Value=0 },
    { Key=ag_1_5periods_wrong_replies ,  Value=0 },
    { Key=ag_1_5periods_warnings ,  Value=0 },
    { Key=ag_1_5periods_succeeded_queries ,  Value=146 },
    { Key=ag_1_5periods_msecsperquery ,  Value=230.85 }],
  error="" ,
  total=0,
  warning="" }
TypeScript
res = await utilsApi.sql("SHOW AGENT STATUS");
{
    "columns": 
    [{
        "Key": 
        {
            "type": "string"
        }
    },
    {
        "Value":
        {
            "type": "string"
        }
    }],
    "data": 
    [
        {"Key": "status_period_seconds", "Value": "60"},
        {"Key": "status_stored_periods", "Value": "15"},
        {"Key": "ag_0_hostname", "Value": "192.168.0.202:6713"},
        {"Key": "ag_0_references", "Value": "2"},
        {"Key": "ag_0_lastquery", "Value": "0.41"},
        {"Key": "ag_0_lastanswer", "Value": "0.19"},
        {"Key": "ag_0_lastperiodmsec", "Value": "222"},
        {"Key": "ag_0_errorsarow", "Value": "0"},
        {"Key": "ag_0_1periods_query_timeouts", "Value": "0"},
        {"Key": "ag_0_1periods_connect_timeouts", "Value": "0"},
        {"Key": "ag_0_1periods_connect_failures", "Value": "0"},
        {"Key": "ag_0_1periods_network_errors", "Value": "0"},
        {"Key": "ag_0_1periods_wrong_replies", "Value": "0"},
        {"Key": "ag_0_1periods_unexpected_closings", "Value": "0"},
        {"Key": "ag_0_1periods_warnings", "Value": "0"},
        {"Key": "ag_0_1periods_succeeded_queries", "Value": "27"},
        {"Key": "ag_0_1periods_msecsperquery", "Value": "232.31"},
        {"Key": "ag_0_5periods_query_timeouts", "Value": "0"},
        {"Key": "ag_0_5periods_connect_timeouts", "Value": "0"},
        {"Key": "ag_0_5periods_connect_failures", "Value": "0"},
        {"Key": "ag_0_5periods_network_errors", "Value": "0"},
        {"Key": "ag_0_5periods_wrong_replies", "Value": "0"},
        {"Key": "ag_0_5periods_unexpected_closings", "Value": "0"},
        {"Key": "ag_0_5periods_warnings", "Value": "0"},
        {"Key": "ag_0_5periods_succeeded_queries", "Value": "146"},
        {"Key": "ag_0_5periods_msecsperquery", "Value": "231.83"},
        {"Key": "ag_1_hostname 192.168.0.202:6714"},
        {"Key": "ag_1_references", "Value": "2"},
        {"Key": "ag_1_lastquery", "Value": "0.41"},
        {"Key": "ag_1_lastanswer", "Value": "0.19"},
        {"Key": "ag_1_lastperiodmsec", "Value": "220"},
        {"Key": "ag_1_errorsarow", "Value": "0"},
        {"Key": "ag_1_1periods_query_timeouts", "Value": "0"},
        {"Key": "ag_1_1periods_connect_timeouts", "Value": "0"},
        {"Key": "ag_1_1periods_connect_failures", "Value": "0"},
        {"Key": "ag_1_1periods_network_errors", "Value": "0"},
        {"Key": "ag_1_1periods_wrong_replies", "Value": "0"},
        {"Key": "ag_1_1periods_unexpected_closings", "Value": "0"},
        {"Key": "ag_1_1periods_warnings", "Value": "0"},
        {"Key": "ag_1_1periods_succeeded_queries", "Value": "27"},
        {"Key": "ag_1_1periods_msecsperquery", "Value": "231.24"},
        {"Key": "ag_1_5periods_query_timeouts", "Value": "0"},
        {"Key": "ag_1_5periods_connect_timeouts", "Value": "0"},
        {"Key": "ag_1_5periods_connect_failures", "Value": "0"},
        {"Key": "ag_1_5periods_network_errors", "Value": "0"},
        {"Key": "ag_1_5periods_wrong_replies", "Value": "0"},
        {"Key": "ag_1_5periods_warnings", "Value": "0"},
        {"Key": "ag_1_5periods_succeeded_queries", "Value": "146"},
        {"Key": "ag_1_5periods_msecsperquery", "Value": "230.85"}
    ],
    "error": "",
    "total": 0,
    "warning": ""
 }
Go
res := apiClient.UtilsAPI.Sql(context.Background()).Body("SHOW AGENT STATUS").Execute()
{
    "columns": 
    [{
        "Key": 
        {
            "type": "string"
        }
    },
    {
        "Value":
        {
            "type": "string"
        }
    }],
    "data": 
    [
        {"Key": "status_period_seconds", "Value": "60"},
        {"Key": "status_stored_periods", "Value": "15"},
        {"Key": "ag_0_hostname", "Value": "192.168.0.202:6713"},
        {"Key": "ag_0_references", "Value": "2"},
        {"Key": "ag_0_lastquery", "Value": "0.41"},
        {"Key": "ag_0_lastanswer", "Value": "0.19"},
        {"Key": "ag_0_lastperiodmsec", "Value": "222"},
        {"Key": "ag_0_errorsarow", "Value": "0"},
        {"Key": "ag_0_1periods_query_timeouts", "Value": "0"},
        {"Key": "ag_0_1periods_connect_timeouts", "Value": "0"},
        {"Key": "ag_0_1periods_connect_failures", "Value": "0"},
        {"Key": "ag_0_1periods_network_errors", "Value": "0"},
        {"Key": "ag_0_1periods_wrong_replies", "Value": "0"},
        {"Key": "ag_0_1periods_unexpected_closings", "Value": "0"},
        {"Key": "ag_0_1periods_warnings", "Value": "0"},
        {"Key": "ag_0_1periods_succeeded_queries", "Value": "27"},
        {"Key": "ag_0_1periods_msecsperquery", "Value": "232.31"},
        {"Key": "ag_0_5periods_query_timeouts", "Value": "0"},
        {"Key": "ag_0_5periods_connect_timeouts", "Value": "0"},
        {"Key": "ag_0_5periods_connect_failures", "Value": "0"},
        {"Key": "ag_0_5periods_network_errors", "Value": "0"},
        {"Key": "ag_0_5periods_wrong_replies", "Value": "0"},
        {"Key": "ag_0_5periods_unexpected_closings", "Value": "0"},
        {"Key": "ag_0_5periods_warnings", "Value": "0"},
        {"Key": "ag_0_5periods_succeeded_queries", "Value": "146"},
        {"Key": "ag_0_5periods_msecsperquery", "Value": "231.83"},
        {"Key": "ag_1_hostname 192.168.0.202:6714"},
        {"Key": "ag_1_references", "Value": "2"},
        {"Key": "ag_1_lastquery", "Value": "0.41"},
        {"Key": "ag_1_lastanswer", "Value": "0.19"},
        {"Key": "ag_1_lastperiodmsec", "Value": "220"},
        {"Key": "ag_1_errorsarow", "Value": "0"},
        {"Key": "ag_1_1periods_query_timeouts", "Value": "0"},
        {"Key": "ag_1_1periods_connect_timeouts", "Value": "0"},
        {"Key": "ag_1_1periods_connect_failures", "Value": "0"},
        {"Key": "ag_1_1periods_network_errors", "Value": "0"},
        {"Key": "ag_1_1periods_wrong_replies", "Value": "0"},
        {"Key": "ag_1_1periods_unexpected_closings", "Value": "0"},
        {"Key": "ag_1_1periods_warnings", "Value": "0"},
        {"Key": "ag_1_1periods_succeeded_queries", "Value": "27"},
        {"Key": "ag_1_1periods_msecsperquery", "Value": "231.24"},
        {"Key": "ag_1_5periods_query_timeouts", "Value": "0"},
        {"Key": "ag_1_5periods_connect_timeouts", "Value": "0"},
        {"Key": "ag_1_5periods_connect_failures", "Value": "0"},
        {"Key": "ag_1_5periods_network_errors", "Value": "0"},
        {"Key": "ag_1_5periods_wrong_replies", "Value": "0"},
        {"Key": "ag_1_5periods_warnings", "Value": "0"},
        {"Key": "ag_1_5periods_succeeded_queries", "Value": "146"},
        {"Key": "ag_1_5periods_msecsperquery", "Value": "230.85"}
    ],
    "error": "",
    "total": 0,
    "warning": ""
 }

An optional LIKE clause is supported, with the syntax being the same as in SHOW STATUS.

SQL
SHOW AGENT STATUS LIKE '%5period%msec%';
+-----------------------------+--------+
| Key                         | Value  |
+-----------------------------+--------+
| ag_0_5periods_msecsperquery | 234.72 |
| ag_1_5periods_msecsperquery | 233.73 |
| ag_2_5periods_msecsperquery | 343.81 |
+-----------------------------+--------+
3 rows in set (0.00 sec)
PHP
$client->nodes()->agentstatus(
    ['body'=>
        ['pattern'=>'%5period%msec%']
    ]
);
Array(
    [ag_0_5periods_msecsperquery] => 234.72
    [ag_1_5periods_msecsperquery] => 233.73
    [ag_2_5periods_msecsperquery] => 343.81
)
Python
utilsApi.sql('SHOW AGENT STATUS LIKE \'%5period%msec%\'')
{u'columns': [{u'Key': {u'type': u'string'}},
              {u'Value': {u'type': u'string'}}],
 u'data': [
    {u'Key': u'ag_0_5periods_msecsperquery', u'Value': u'234.72'},
    {u'Key': u'ag_1_5periods_msecsperquery', u'Value': u'233.73'},
    {u'Key': u'ag_2_5periods_msecsperquery', u'Value': u'343.81'}],
 u'error': u'',
 u'total': 0,
 u'warning': u''}
javascript
res = await utilsApi.sql("SHOW AGENT STATUS LIKE \"%5period%msec%\"");
{"columns": [{"Key": {"type": "string"}},
              {"Value": {"type": "string"}}],
 "data": [
    {"Key": "ag_0_5periods_msecsperquery", "Value": "234.72"},
    {"Key": "ag_1_5periods_msecsperquery", "Value": "233.73"},
    {"Key": "ag_2_5periods_msecsperquery", "Value": "343.81"}],
 "error": "",
 "total": 0,
 "warning": ""}
Java
utilsApi.sql("SHOW AGENT STATUS LIKE \"%5period%msec%\"");
{columns: [{Key={type=string}},
              {Value={type=string}}],
 data: [
    {Key=ag_0_5periods_msecsperquery, Value=234.72},
    {Key=ag_1_5periods_msecsperquery, Value=233.73},
    {Key=ag_2_5periods_msecsperquery, Value=343.81}],
 error: ,
 total: 0,
 warning: }
C#
utilsApi.Sql("SHOW AGENT STATUS LIKE \"%5period%msec%\"");
{columns: [{Key={type=string}},
              {Value={type=string}}],
 data: [
    {Key=ag_0_5periods_msecsperquery, Value=234.72},
    {Key=ag_1_5periods_msecsperquery, Value=233.73},
    {Key=ag_2_5periods_msecsperquery, Value=343.81}],
 error: "",
 total: 0,
 warning: ""}
TypeScript
res = await utilsApi.sql("SHOW AGENT STATUS LIKE \"%5period%msec%\"");
{
    "columns": 
    [{
        "Key": {"type": "string"}
    },
    {
        "Value": {"type": "string"}
    }],
    "data": 
    [
        {"Key": "ag_0_5periods_msecsperquery", "Value": "234.72"},
        {"Key": "ag_1_5periods_msecsperquery", "Value": "233.73"},
        {"Key": "ag_2_5periods_msecsperquery", "Value": "343.81"}
    ],
    "error": "",
    "total": 0,
    "warning": ""
}
Go
apiClient.UtilsAPI.Sql(context.Background()).Body("SHOW AGENT STATUS LIKE \"%5period%msec%\"").Execute()
{
    "columns": 
    [{
        "Key": {"type": "string"}
    },
    {
        "Value": {"type": "string"}
    }],
    "data": 
    [
        {"Key": "ag_0_5periods_msecsperquery", "Value": "234.72"},
        {"Key": "ag_1_5periods_msecsperquery", "Value": "233.73"},
        {"Key": "ag_2_5periods_msecsperquery", "Value": "343.81"}
    ],
    "error": "",
    "total": 0,
    "warning": ""
}

You can specify a particular agent by its address. In this case, only that agent's data will be displayed. Additionally, the agent_ prefix will be used instead of ag_N_:

SQL
SHOW AGENT '192.168.0.202:6714' STATUS LIKE '%15periods%';
+-------------------------------------+--------+
| Variable_name                       | Value  |
+-------------------------------------+--------+
| agent_15periods_query_timeouts      | 0      |
| agent_15periods_connect_timeouts    | 0      |
| agent_15periods_connect_failures    | 0      |
| agent_15periods_network_errors      | 0      |
| agent_15periods_wrong_replies       | 0      |
| agent_15periods_unexpected_closings | 0      |
| agent_15periods_warnings            | 0      |
| agent_15periods_succeeded_queries   | 439    |
| agent_15periods_msecsperquery       | 231.73 |
+-------------------------------------+--------+
9 rows in set (0.00 sec)
PHP
$client->nodes()->agentstatus(
    ['body'=>
        ['agent'=>'192.168.0.202:6714'],
        ['pattern'=>'%5period%msec%']
    ]
);
Array(
    [agent_15periods_query_timeouts] => 0
    [agent_15periods_connect_timeouts] => 0
    [agent_15periods_connect_failures] => 0
    [agent_15periods_network_errors] => 0
    [agent_15periods_wrong_replies] => 0
    [agent_15periods_unexpected_closings] => 0
    [agent_15periods_warnings] => 0
    [agent_15periods_succeeded_queries] => 439
    [agent_15periods_msecsperquery] => 231.73
)
Python
utilsApi.sql('SHOW AGENT \'192.168.0.202:6714\' STATUS LIKE \'%15periods%\'')
{u'columns': [{u'Key': {u'type': u'string'}},
              {u'Value': {u'type': u'string'}}],
 u'data': [
    {u'Key': u'agent_15periods_query_timeouts', u'Value': u'0'},
    {u'Key': u'agent_15periods_connect_timeouts', u'Value': u'0'},
    {u'Key': u'agent_15periods_connect_failures', u'Value': u'0'},
    {u'Key': u'agent_15periods_network_errors', u'Value': u'0'},
    {u'Key': u'agent_15periods_connect_failures', u'Value': u'0'},
    {u'Key': u'agent_15periods_wrong_replies', u'Value': u'0'},
    {u'Key': u'agent_15periods_unexpected_closings', u'Value': u'0'},
    {u'Key': u'agent_15periods_warnings', u'Value': u'0'},
    {u'Key': u'agent_15periods_succeeded_queries', u'Value': u'439'},
    {u'Key': u'agent_15periods_msecsperquery', u'Value': u'233.73'},
    ],
 u'error': u'',
 u'total': 0,
 u'warning': u''}
javascript
res = await utilsApi.sql("SHOW AGENT \"192.168.0.202:6714\" STATUS LIKE \"%15periods%\"");
{"columns": [{"Key": {"type": "string"}},
              {"Value": {"type": "string"}}],
 "data": [
    {"Key": "agent_15periods_query_timeouts", "Value": "0"},
    {"Key": "agent_15periods_connect_timeouts", "Value": "0"},
    {"Key": "agent_15periods_connect_failures", "Value": "0"},
    {"Key": "agent_15periods_network_errors", "Value": "0"},
    {"Key": "agent_15periods_connect_failures", "Value": "0"},
    {"Key": "agent_15periods_wrong_replies", "Value": "0"},
    {"Key": "agent_15periods_unexpected_closings", "Value": "0"},
    {"Key": "agent_15periods_warnings", "Value": "0"},
    {"Key": "agent_15periods_succeeded_queries", "Value": "439"},
    {"Key": "agent_15periods_msecsperquery", "Value": "233.73"},
    ],
 "error": "",
 "total": 0,
 "warning": ""}
Java
utilsApi.sql("SHOW AGENT \"192.168.0.202:6714\" STATUS LIKE \"%15periods%\"");
{columns=[{Key={type=string}},
              {Value={type=string}}],
 data=[
    {Key=agent_15periods_query_timeouts, Value=0},
    {Key=agent_15periods_connect_timeouts, Value=0},
    {Key=agent_15periods_connect_failures, Value=0},
    {Key=agent_15periods_network_errors, Value=0},
    {Key=agent_15periods_connect_failures, Value=0},
    {Key=agent_15periods_wrong_replies, Value=0},
    {Key=agent_15periods_unexpected_closings, Value=0},
    {Key=agent_15periods_warnings, Value=0},
    {Key=agent_15periods_succeeded_queries, Value=439},
    {Key=agent_15periods_msecsperquery, Value=233.73},
    ],
 error=,
 total=0,
 warning=}
C#
utilsApi.Sql("SHOW AGENT \"192.168.0.202:6714\" STATUS LIKE \"%15periods%\"");
{columns=[{Key={type=string}},
              {Value={type=string}}],
 data=[
    {Key=agent_15periods_query_timeouts, Value=0},
    {Key=agent_15periods_connect_timeouts, Value=0},
    {Key=agent_15periods_connect_failures, Value=0},
    {Key=agent_15periods_network_errors, Value=0},
    {Key=agent_15periods_connect_failures, Value=0},
    {Key=agent_15periods_wrong_replies, Value=0},
    {Key=agent_15periods_unexpected_closings, Value=0},
    {Key=agent_15periods_warnings, Value=0},
    {Key=agent_15periods_succeeded_queries, Value=439},
    {Key=agent_15periods_msecsperquery, Value=233.73},
    ],
 error="",
 total=0,
 warning=""}
TypeScript
res = await utilsApi.sql("SHOW AGENT \"192.168.0.202:6714\" STATUS LIKE \"%15periods%\"");
{
    "columns": 
    [{
        {"Key": {"type": "string"}
    },
        {"Value": {"type": "string"}
    }],
    "data": 
    [
        {"Key": "agent_15periods_query_timeouts", "Value": "0"},
        {"Key": "agent_15periods_connect_timeouts", "Value": "0"},
        {"Key": "agent_15periods_connect_failures", "Value": "0"},
        {"Key": "agent_15periods_network_errors", "Value": "0"},
        {"Key": "agent_15periods_connect_failures", "Value": "0"},
        {"Key": "agent_15periods_wrong_replies", "Value": "0"},
        {"Key": "agent_15periods_unexpected_closings", "Value": "0"},
        {"Key": "agent_15periods_warnings", "Value": "0"},
        {"Key": "agent_15periods_succeeded_queries", "Value": "439"},
        {"Key": "agent_15periods_msecsperquery", "Value": "233.73"},
    ],
    "error": "",
    "total": 0,
    "warning": ""
}
Go
apiClient.UtilsAPI.Sql(context.Background()).Body("SHOW AGENT \"192.168.0.202:6714\" STATUS LIKE \"%15periods%\").Execute()
{
    "columns": 
    [{
        {"Key": {"type": "string"}
    },
        {"Value": {"type": "string"}
    }],
    "data": 
    [
        {"Key": "agent_15periods_query_timeouts", "Value": "0"},
        {"Key": "agent_15periods_connect_timeouts", "Value": "0"},
        {"Key": "agent_15periods_connect_failures", "Value": "0"},
        {"Key": "agent_15periods_network_errors", "Value": "0"},
        {"Key": "agent_15periods_connect_failures", "Value": "0"},
        {"Key": "agent_15periods_wrong_replies", "Value": "0"},
        {"Key": "agent_15periods_unexpected_closings", "Value": "0"},
        {"Key": "agent_15periods_warnings", "Value": "0"},
        {"Key": "agent_15periods_succeeded_queries", "Value": "439"},
        {"Key": "agent_15periods_msecsperquery", "Value": "233.73"},
    ],
    "error": "",
    "total": 0,
    "warning": ""
}

Finally, you can check the status of the agents in a specific distributed table using the SHOW AGENT index_name STATUS statement. This statement displays the table's HA status (i.e., whether or not it uses agent mirrors at all) and provides information on the mirrors, including: address, blackhole and persistent flags, and the mirror selection probability used when one of the weighted probability strategies is in effect.

SQL
SHOW AGENT dist_index STATUS;
+--------------------------------------+--------------------------------+
| Variable_name                        | Value                          |
+--------------------------------------+--------------------------------+
| dstindex_1_is_ha                     | 1                              |
| dstindex_1mirror1_id                 | 192.168.0.202:6713:loc         |
| dstindex_1mirror1_probability_weight | 0.372864                       |
| dstindex_1mirror1_is_blackhole       | 0                              |
| dstindex_1mirror1_is_persistent      | 0                              |
| dstindex_1mirror2_id                 | 192.168.0.202:6714:loc         |
| dstindex_1mirror2_probability_weight | 0.374635                       |
| dstindex_1mirror2_is_blackhole       | 0                              |
| dstindex_1mirror2_is_persistent      | 0                              |
| dstindex_1mirror3_id                 | dev1.manticoresearch.com:6714:loc |
| dstindex_1mirror3_probability_weight | 0.252501                       |
| dstindex_1mirror3_is_blackhole       | 0                              |
| dstindex_1mirror3_is_persistent      | 0                              |
+--------------------------------------+--------------------------------+
13 rows in set (0.00 sec)
PHP
$client->nodes()->agentstatus(
    ['body'=>
        ['agent'=>'dist_index']
    ]
);
Array(
    [dstindex_1_is_ha] => 1
    [dstindex_1mirror1_id] => 192.168.0.202:6713:loc
    [dstindex_1mirror1_probability_weight] => 0.372864
    [dstindex_1mirror1_is_blackhole] => 0
    [dstindex_1mirror1_is_persistent] => 0
    [dstindex_1mirror2_id] => 192.168.0.202:6714:loc
    [dstindex_1mirror2_probability_weight] => 0.374635
    [dstindex_1mirror2_is_blackhole] => 0
    [dstindex_1mirror2_is_persistent] => 0
    [dstindex_1mirror3_id] => dev1.manticoresearch.com:6714:loc
    [dstindex_1mirror3_probability_weight] => 0.252501
    [dstindex_1mirror3_is_blackhole] => 0
    [dstindex_1mirror3_is_persistent] => 0
)
Python
utilsApi.sql('SHOW AGENT \'192.168.0.202:6714\' STATUS LIKE \'%15periods%\'')
{u'columns': [{u'Key': {u'type': u'string'}},
              {u'Value': {u'type': u'string'}}],
 u'data': [
    {u'Key': u'dstindex_1_is_ha', u'Value': u'1'},
    {u'Key': u'dstindex_1mirror1_id', u'Value': u'192.168.0.202:6713:loc'},
    {u'Key': u'dstindex_1mirror1_probability_weight', u'Value': u'0.372864'},
    {u'Key': u'dstindex_1mirror1_is_blackhole', u'Value': u'0'},
    {u'Key': u'dstindex_1mirror1_is_persistent', u'Value': u'0'},
    {u'Key': u'dstindex_1mirror2_id', u'Value': u'192.168.0.202:6714:loc'},
    {u'Key': u'dstindex_1mirror2_probability_weight', u'Value': u'0.374635'},
    {u'Key': u'dstindex_1mirror2_is_blackhole', u'Value': u'0'},
    {u'Key': u'dstindex_1mirror2_is_persistent', u'Value': u'439'},
    {u'Key': u'dstindex_1mirror3_id', u'Value': u'dev1.manticoresearch.com:6714:loc'},
    {u'Key': u'dstindex_1mirror3_probability_weight', u'Value': u' 0.252501'},
    {u'Key': u'dstindex_1mirror3_is_blackhole', u'Value': u'0'},
    {u'Key': u'dstindex_1mirror3_is_persistent', u'Value': u'439'}    
    ],
 u'error': u'',
 u'total': 0,
 u'warning': u''}
javascript
res = await utilsApi.sql("SHOW AGENT \"192.168.0.202:6714\" STATUS LIKE \"%15periods%\"");
{"columns": [{"Key": {"type": "string"}},
              {"Value": {"type": "string"}}],
 "data": [
    {"Key": "dstindex_1_is_ha", "Value": "1"},
    {"Key": "dstindex_1mirror1_id", "Value": "192.168.0.202:6713:loc"},
    {"Key": "dstindex_1mirror1_probability_weight", "Value": "0.372864"},
    {"Key": "dstindex_1mirror1_is_blackhole", "Value": "0"},
    {"Key": "dstindex_1mirror1_is_persistent", "Value": "0"},
    {"Key": "dstindex_1mirror2_id", "Value": "192.168.0.202:6714:loc"},
    {"Key": "dstindex_1mirror2_probability_weight", "Value": "0.374635"},
    {"Key": "dstindex_1mirror2_is_blackhole", "Value": "0"},
    {"Key": "dstindex_1mirror2_is_persistent", "Value": "439"},
    {"Key": "dstindex_1mirror3_id", "Value": "dev1.manticoresearch.com:6714:loc"},
    {"Key": "dstindex_1mirror3_probability_weight", "Value": " 0.252501"},
    {"Key": "dstindex_1mirror3_is_blackhole", "Value": "0"},
    {"Key": "dstindex_1mirror3_is_persistent", "Value": "439"}    
    ],
 "error": "",
 "total": 0,
 "warning": ""}
Java
utilsApi.sql("SHOW AGENT \"192.168.0.202:6714\" STATUS LIKE \"%15periods%\"");
{columns=[{Key={type=string}},
              {Value={type=string}}],
 data=[
    {Key=dstindex_1_is_ha, Value=1},
    {Key=dstindex_1mirror1_id, Value=192.168.0.202:6713:loc},
    {Key=dstindex_1mirror1_probability_weight, Value=0.372864},
    {Key=dstindex_1mirror1_is_blackhole, Value=0},
    {Key=dstindex_1mirror1_is_persistent, Value=0},
    {Key=dstindex_1mirror2_id, Value=192.168.0.202:6714:loc},
    {Key=dstindex_1mirror2_probability_weight, Value=0.374635},
    {Key=dstindex_1mirror2_is_blackhole, Value=0},
    {Key=dstindex_1mirror2_is_persistent, Value=439},
    {Key=dstindex_1mirror3_id, Value=dev1.manticoresearch.com:6714:loc},
    {Key=dstindex_1mirror3_probability_weight, Value= 0.252501},
    {Key=dstindex_1mirror3_is_blackhole, Value=0},
    {Key=dstindex_1mirror3_is_persistent, Value=439}    
    ],
 error=,
 total=0,
 warning=}
C#
utilsApi.Sql("SHOW AGENT \"192.168.0.202:6714\" STATUS LIKE \"%15periods%\"");
{columns=[{Key={type=string}},
              {Value={type=string}}],
 data=[
    {Key=dstindex_1_is_ha, Value=1},
    {Key=dstindex_1mirror1_id, Value=192.168.0.202:6713:loc},
    {Key=dstindex_1mirror1_probability_weight, Value=0.372864},
    {Key=dstindex_1mirror1_is_blackhole, Value=0},
    {Key=dstindex_1mirror1_is_persistent, Value=0},
    {Key=dstindex_1mirror2_id, Value=192.168.0.202:6714:loc},
    {Key=dstindex_1mirror2_probability_weight, Value=0.374635},
    {Key=dstindex_1mirror2_is_blackhole, Value=0},
    {Key=dstindex_1mirror2_is_persistent, Value=439},
    {Key=dstindex_1mirror3_id, Value=dev1.manticoresearch.com:6714:loc},
    {Key=dstindex_1mirror3_probability_weight, Value= 0.252501},
    {Key=dstindex_1mirror3_is_blackhole, Value=0},
    {Key=dstindex_1mirror3_is_persistent, Value=439}    
    ],
 error="",
 total=0,
 warning=""}
TypeScript
res = await utilsApi.sql("SHOW AGENT \"192.168.0.202:6714\" STATUS LIKE \"%15periods%\"");
{
    "columns": 
    [{
        "Key": {"type": "string"}},
        {"Value": {"type": "string"}
    }],
    "data": 
    [
        {"Key": "dstindex_1_is_ha", "Value": "1"},
        {"Key": "dstindex_1mirror1_id", "Value": "192.168.0.202:6713:loc"},
        {"Key": "dstindex_1mirror1_probability_weight", "Value": "0.372864"},
        {"Key": "dstindex_1mirror1_is_blackhole", "Value": "0"},
        {"Key": "dstindex_1mirror1_is_persistent", "Value": "0"},
        {"Key": "dstindex_1mirror2_id", "Value": "192.168.0.202:6714:loc"},
        {"Key": "dstindex_1mirror2_probability_weight", "Value": "0.374635"},
        {"Key": "dstindex_1mirror2_is_blackhole", "Value": "0"},
        {"Key": "dstindex_1mirror2_is_persistent", "Value": "439"},
        {"Key": "dstindex_1mirror3_id", "Value": "dev1.manticoresearch.com:6714:loc"},
        {"Key": "dstindex_1mirror3_probability_weight", "Value": " 0.252501"},
        {"Key": "dstindex_1mirror3_is_blackhole", "Value": "0"},
        {"Key": "dstindex_1mirror3_is_persistent", "Value": "439"}    
    ],
    "error": "",
    "total": 0,
    "warning": ""
}
Go
apiClient.UtilsAPI.Sql(context.Background()).Body("SHOW AGENT \"192.168.0.202:6714\" STATUS LIKE \"%15periods%\"").Execute()
{
    "columns": 
    [{
        "Key": {"type": "string"}},
        {"Value": {"type": "string"}
    }],
    "data": 
    [
        {"Key": "dstindex_1_is_ha", "Value": "1"},
        {"Key": "dstindex_1mirror1_id", "Value": "192.168.0.202:6713:loc"},
        {"Key": "dstindex_1mirror1_probability_weight", "Value": "0.372864"},
        {"Key": "dstindex_1mirror1_is_blackhole", "Value": "0"},
        {"Key": "dstindex_1mirror1_is_persistent", "Value": "0"},
        {"Key": "dstindex_1mirror2_id", "Value": "192.168.0.202:6714:loc"},
        {"Key": "dstindex_1mirror2_probability_weight", "Value": "0.374635"},
        {"Key": "dstindex_1mirror2_is_blackhole", "Value": "0"},
        {"Key": "dstindex_1mirror2_is_persistent", "Value": "439"},
        {"Key": "dstindex_1mirror3_id", "Value": "dev1.manticoresearch.com:6714:loc"},
        {"Key": "dstindex_1mirror3_probability_weight", "Value": " 0.252501"},
        {"Key": "dstindex_1mirror3_is_blackhole", "Value": "0"},
        {"Key": "dstindex_1mirror3_is_persistent", "Value": "439"}    
    ],
    "error": "",
    "total": 0,
    "warning": ""
}
¶ 19.2

SHOW META

SHOW META [ LIKE pattern ]

SHOW META is an SQL statement that displays additional meta-information about the processed query, including the query time, keyword statistics, and information about the secondary indexes used. The syntax is:

The included items are:

SQL
SELECT id, story_author FROM hn_small WHERE MATCH('one|two|three') and comment_ranking > 2 limit 5;
show meta;
+---------+--------------+
| id      | story_author |
+---------+--------------+
|  151171 | anewkid      |
|  302758 | bks          |
|  805806 | drRoflol     |
| 1099245 | tnorthcutt   |
|  303252 | whiten       |
+---------+--------------+
5 rows in set (0.00 sec)

+----------------+---------------------------------------+
| Variable_name  | Value                                 |
+----------------+---------------------------------------+
| total          | 5                                     |
| total_found    | 2308                                  |
| total_relation | eq                                    |
| time           | 0.001                                 |
| keyword[0]     | one                                   |
| docs[0]        | 224387                                |
| hits[0]        | 310327                                |
| keyword[1]     | three                                 |
| docs[1]        | 18181                                 |
| hits[1]        | 21102                                 |
| keyword[2]     | two                                   |
| docs[2]        | 63251                                 |
| hits[2]        | 75961                                 |
| index          | comment_ranking:SecondaryIndex (100%) |
+----------------+---------------------------------------+
14 rows in set (0.00 sec)

SHOW META can display I/O and CPU counters, but they will only be available if searchd was started with the --iostats and --cpustats switches, respectively.

SQL
SELECT id,channel_id FROM records WHERE MATCH('one|two|three') limit 5;

SHOW META;
+--------+--------------+
| id     | story_author |
+--------+--------------+
| 300263 | throwaway37  |
| 713503 | mahmud       |
| 716804 | mahmud       |
| 776906 | jimbokun     |
| 753332 | foxhop       |
+--------+--------------+
5 rows in set (0.01 sec)

+-----------------------+--------+
| Variable_name         | Value  |
+-----------------------+--------+
| total                 | 5      |
| total_found           | 266385 |
| total_relation        | eq     |
| time                  | 0.011  |
| cpu_time              | 18.004 |
| agents_cpu_time       | 0.000  |
| io_read_time          | 0.000  |
| io_read_ops           | 0      |
| io_read_kbytes        | 0.0    |
| io_write_time         | 0.000  |
| io_write_ops          | 0      |
| io_write_kbytes       | 0.0    |
| agent_io_read_time    | 0.000  |
| agent_io_read_ops     | 0      |
| agent_io_read_kbytes  | 0.0    |
| agent_io_write_time   | 0.000  |
| agent_io_write_ops    | 0      |
| agent_io_write_kbytes | 0.0    |
| keyword[0]            | one    |
| docs[0]               | 224387 |
| hits[0]               | 310327 |
| keyword[1]            | three  |
| docs[1]               | 18181  |
| hits[1]               | 21102  |
| keyword[2]            | two    |
| docs[2]               | 63251  |
| hits[2]               | 75961  |
+-----------------------+--------+
27 rows in set (0.00 sec)

Additional values, such as predicted_time, dist_predicted_time, local_fetched_docs, local_fetched_hits, local_fetched_skips, and their respective dist_fetched_* counterparts, will only be available if searchd was configured with predicted time costs and the query included predicted_time in the OPTION clause.

SQL
SELECT id,story_author FROM hn_small WHERE MATCH('one|two|three') limit 5 option max_predicted_time=100;

SHOW META;
+--------+--------------+
| id     | story_author |
+--------+--------------+
| 300263 | throwaway37  |
| 713503 | mahmud       |
| 716804 | mahmud       |
| 776906 | jimbokun     |
| 753332 | foxhop       |
+--------+--------------+
5 rows in set (0.01 sec)

mysql> show meta;
+---------------------+--------+
| Variable_name       | Value  |
+---------------------+--------+
| total               | 5      |
| total_found         | 266385 |
| total_relation      | eq     |
| time                | 0.012  |
| local_fetched_docs  | 307212 |
| local_fetched_hits  | 407390 |
| local_fetched_skips | 24     |
| predicted_time      | 56     |
| keyword[0]          | one    |
| docs[0]             | 224387 |
| hits[0]             | 310327 |
| keyword[1]          | three  |
| docs[1]             | 18181  |
| hits[1]             | 21102  |
| keyword[2]          | two    |
| docs[2]             | 63251  |
| hits[2]             | 75961  |
+---------------------+--------+
17 rows in set (0.00 sec)

SHOW META must be executed immediately after the query in the same session. Since some MySQL connectors/libraries use connection pools, running SHOW META in a separate statement can lead to unexpected results, such as retrieving metadata from another query. In these cases (and generally recommended), run a multiple statement containing both the query and SHOW META. Some connectors/libraries support multi-queries within the same method for a single statement, while others may require the use of a dedicated method for multi-queries or setting specific options during connection setup.

SQL
SELECT id,story_author FROM hn_small WHERE MATCH('one|two|three') LIMIT 5; SHOW META;
+--------+--------------+
| id     | story_author |
+--------+--------------+
| 300263 | throwaway37  |
| 713503 | mahmud       |
| 716804 | mahmud       |
| 776906 | jimbokun     |
| 753332 | foxhop       |
+--------+--------------+
5 rows in set (0.01 sec)

+----------------+--------+
| Variable_name  | Value  |
+----------------+--------+
| total          | 5      |
| total_found    | 266385 |
| total_relation | eq     |
| time           | 0.011  |
| keyword[0]     | one    |
| docs[0]        | 224387 |
| hits[0]        | 310327 |
| keyword[1]     | three  |
| docs[1]        | 18181  |
| hits[1]        | 21102  |
| keyword[2]     | two    |
| docs[2]        | 63251  |
| hits[2]        | 75961  |
+----------------+--------+
13 rows in set (0.00 sec)

You can also use the optional LIKE clause, which allows you to select only the variables that match a specific pattern. The pattern syntax follows standard SQL wildcards, where % represents any number of any characters, and _ represents a single character.

SQL
SHOW META LIKE 'total%';
+----------------+--------+
| Variable_name  | Value  |
+----------------+--------+
| total          | 5      |
| total_found    | 266385 |
| total_relation | eq     |
+----------------+--------+
3 rows in set (0.00 sec)

SHOW META and facets

When utilizing faceted search, you can examine the multiplier field in the SHOW META output to determine how many queries were executed in an optimized group.

SQL
SELECT * FROM facetdemo FACET brand_id FACET price FACET categories;
SHOW META LIKE 'multiplier';
+------+-------+----------+---------------------+-------------+-------------+---------------------------------------+------------+
| id   | price | brand_id | title               | brand_name  | property    | j                                     | categories |
+------+-------+----------+---------------------+-------------+-------------+---------------------------------------+------------+
|    1 |   306 |        1 | Product Ten Three   | Brand One   | Six_Ten     | {"prop1":66,"prop2":91,"prop3":"One"} | 10,11      |
...

+----------+----------+
| brand_id | count(*) |
+----------+----------+
|        1 |     1013 |
...

+-------+----------+
| price | count(*) |
+-------+----------+
|   306 |        7 |
...

+------------+----------+
| categories | count(*) |
+------------+----------+
|         10 |     2436 |
...

+---------------+-------+
| Variable_name | Value |
+---------------+-------+
| multiplier    | 4     |
+---------------+-------+
1 row in set (0.00 sec)

SHOW META and query optimizer

When the cost-based query optimizer chooses to use DocidIndex, ColumnarScan, or SecondaryIndex instead of a plain filter, this is reflected in the SHOW META command.

The index variable displays the names and types of secondary indexes used during query execution. The percentage indicates how many disk chunks (in the case of an RT table) or pseudo shards (in the case of a plain table) utilized the secondary index.

SQL
SELECT count(*) FROM taxi1 WHERE tip_amount = 5;
SHOW META;
+----------------+----------------------------------+
| Variable_name  | Value                            |
+----------------+----------------------------------+
| total          | 1                                |
| total_found    | 1                                |
| total_relation | eq                               |
| time           | 0.016                            |
| index          | tip_amount:SecondaryIndex (100%) |
+----------------+----------------------------------+
5 rows in set (0.00 sec)

SHOW META for PQ tables

SHOW META can be used after executing a CALL PQ statement, in which case it provides different output.

SHOW META following a CALL PQ statement includes:

SQL
CALL PQ ('pq', ('{"title":"angry", "gid":3 }')); SHOW META;
+------+
| id   |
+------+
|    2 |
+------+
1 row in set (0.00 sec)

+-----------------------+-----------+
| Name                  | Value     |
+-----------------------+-----------+
| Total                 | 0.000 sec |
| Queries matched       | 1         |
| Queries failed        | 0         |
| Document matched      | 1         |
| Total queries stored  | 2         |
| Term only queries     | 2         |
| Fast rejected queries | 1         |
+-----------------------+-----------+
7 rows in set (0.00 sec)

Using CALL PQ with a verbose option provides more detailed output.

It includes the following additional entries:

SQL
CALL PQ ('pq', ('{"title":"angry", "gid":3 }'), 1 as verbose); SHOW META;
+------+
| id   |
+------+
|    2 |
+------+
1 row in set (0.00 sec)

+-------------------------+-----------+
| Name                    | Value     |
+-------------------------+-----------+
| Total                   | 0.000 sec |
| Setup                   | 0.000 sec |
| Queries matched         | 1         |
| Queries failed          | 0         |
| Document matched        | 1         |
| Total queries stored    | 2         |
| Term only queries       | 2         |
| Fast rejected queries   | 1         |
| Time per query          | 69        |
| Time of matched queries | 69        |
+-------------------------+-----------+
10 rows in set (0.00 sec)
¶ 19.3

SHOW THREADS

SHOW THREADS [ OPTION columns=width[,format=sphinxql][,format=all] ]

SHOW THREADS is an SQL statement that displays information about all threads and their current activities.

The resulting table contains the following columns:

SQL
SHOW THREADS;
*************************** 1. row ***************************
                TID: 83
               Name: work_1
              Proto: mysql
              State: query
    Connection from: 172.17.0.1:43300
             ConnID: 8
 This/prev job time: 630us
       CPU activity: 94.15%
          Jobs done: 2490
      Thread status: working
               Info: SHOW THREADS 

*************************** 2. row ***************************
                TID: 84
               Name: work_2
              Proto: mysql
              State: query
    Connection from: 172.17.0.1:43301
             ConnID: 9
 This/prev job time: 689us
       CPU activity: 89.23%
          Jobs done: 1830
      Thread status: working
               Info: show threads
JSON
POST /cli -d "SHOW THREADS"
+--------+---------+-------+-------+-----------------+--------+-----------------------+-----------+---------------+--------------+
| TID    | Name    | Proto | State | Connection from | ConnID | This/prev job time, s | Jobs done | Thread status | Info         |
+--------+---------+-------+-------+-----------------+--------+-----------------------+-----------+---------------+--------------+
| 501494 | work_23 | http  | query | 127.0.0.1:41300 | 1473   | 249us                 | 1681      | working       | show_threads |
+--------+---------+-------+-------+-----------------+--------+-----------------------+-----------+---------------+--------------+
PHP
require_once __DIR__ . '/vendor/autoload.php';
$config = ['host'=>'127.0.0.1','port'=>9308];
$client = new \Manticoresearch\Client($config);
print_r($client->nodes()->threads());
Array
(
    [0] => Array
        (
            [TID] => 506960
            [Name] => work_8
            [Proto] => http
            [State] => query
            [Connection from] => 127.0.0.1:38072
            [ConnID] => 17
            [This/prev job time, s] => 231us
            [CPU activity] => 93.54%
            [Jobs done] => 8
            [Thread status] => working
            [Info] => show_threads
        )

)
Python
import manticoresearch
config = manticoresearch.Configuration(
            host = "http://127.0.0.1:9308"
            )
client = manticoresearch.ApiClient(config)
utilsApi = manticoresearch.UtilsApi(client)
print(utilsApi.sql('SHOW THREADS'))
[{'columns': [{'TID': {'type': 'long'}}, {'Name': {'type': 'string'}}, {'Proto': {'type': 'string'}}, {'State': {'type': 'string'}}, {'Connection from': {'type': 'string'}}, {'ConnID': {'type': 'long long'}}, {'This/prev job time, s': {'type': 'string'}}, {'CPU activity': {'type': 'float'}}, {'Jobs done': {'type': 'long'}}, {'Thread status': {'type': 'string'}}, {'Info': {'type': 'string'}}], 'data': [{'TID': 506958, 'Name': 'work_6', 'Proto': 'http', 'State': 'query', 'Connection from': '127.0.0.1:38600', 'ConnID': 834, 'This/prev job time, s': '206us', 'CPU activity': '91.85%', 'Jobs done': 943, 'Thread status': 'working', 'Info': 'show_threads'}], 'total': 1, 'error': '', 'warning': ''}]
javascript
var Manticoresearch = require('manticoresearch');

var utilsApi = new Manticoresearch.UtilsApi();
async function showThreads() {
    res = await utilsApi.sql('SHOW THREADS');
    console.log(JSON.stringify(res, null, 4));
}

showThreads();
[
    {
        "columns": [
            {
                "TID": {
                    "type": "long"
                }
            },
            {
                "Name": {
                    "type": "string"
                }
            },
            {
                "Proto": {
                    "type": "string"
                }
            },
            {
                "State": {
                    "type": "string"
                }
            },
            {
                "Connection from": {
                    "type": "string"
                }
            },
            {
                "ConnID": {
                    "type": "long long"
                }
            },
            {
                "This/prev job time, s": {
                    "type": "string"
                }
            },
            {
                "CPU activity": {
                    "type": "float"
                }
            },
            {
                "Jobs done": {
                    "type": "long"
                }
            },
            {
                "Thread status": {
                    "type": "string"
                }
            },
            {
                "Info": {
                    "type": "string"
                }
            }
        ],
        "data": [
            {
                "TID": 506964,
                "Name": "work_12",
                "Proto": "http",
                "State": "query",
                "Connection from": "127.0.0.1:36656",
                "ConnID": 2884,
                "This/prev job time, s": "236us",
                "CPU activity": "91.73%",
                "Jobs done": 3328,
                "Thread status": "working",
                "Info": "show_threads"
            }
        ],
        "total": 1,
        "error": "",
        "warning": ""
    }
]
Java
utilsApi.sql("SHOW THREADS");
{
  columns=[
    {
      TID={
        type=string
      }
    },
    {
      Name={
        type=string
      }
    },
    {
      Proto={
        type=string
      }
    },
    {
      State={
        type=string
      }
    },
    {
      Connection from={
        type=string
      }
    },
    {
      ConnID={
        type=string
      }
    },
    {
      This/prev job time={
        type=string
      }
    },
    {
      CPU activity={
        type=string
      }
    },
    {
      Jobs done={
        type=string
      }
    },
    {
      Thread status={
        type=string
      }
    },
    {
      Info={
        type=string
      }
    }
  ],
  data=[
    {
      TID=82,
      Name=work_0,
      Proto=http,
      State=query,
      Connection from=172.17.0.1:60550,
      ConnID=163,
      This/prev job time=105us,
      CPU activity=44.68%,
      Jobs done=849,
      Thread status=working,
      Info=show_threads
    }
  ],
  total=0,
  error=,
  warning=
}
C#
utilsApi.Sql("SHOW THREADS");
{
  columns=[
    {
      TID={
        type=string
      }
    },
    {
      Name={
        type=string
      }
    },
    {
      Proto={
        type=string
      }
    },
    {
      State={
        type=string
      }
    },
    {
      Connection from={
        type=string
      }
    },
    {
      ConnID={
        type=string
      }
    },
    {
      This/prev job time= {
        type=string
      }
    },
    {
      Jobs done={
        type=string
      }
    },
    {
      Thread status={
        type=string
      }
    },
    {
      Info={
        type=string
      }
    }
  ],
  data=[
    {
      TID=83,
      Name=work_1,
      Proto=http,
      State=query,
      Connection from=172.17.0.1:41410,
      ConnID=6,
      This/prev job time=689us,
      Jobs done=159,
      Thread status=working,
      Info=show_threads
    }
  ],
  total=0,
  error="",
  warning=""
}
TypeScript
res = await utilsApi.sql('SHOW THREADS');
[
    {
        "columns": [
            {
                "TID": {
                    "type": "long"
                }
            },
            {
                "Name": {
                    "type": "string"
                }
            },
            {
                "Proto": {
                    "type": "string"
                }
            },
            {
                "State": {
                    "type": "string"
                }
            },
            {
                "Connection from": {
                    "type": "string"
                }
            },
            {
                "ConnID": {
                    "type": "long long"
                }
            },
            {
                "This/prev job time, s": {
                    "type": "string"
                }
            },
            {
                "CPU activity": {
                    "type": "float"
                }
            },
            {
                "Jobs done": {
                    "type": "long"
                }
            },
            {
                "Thread status": {
                    "type": "string"
                }
            },
            {
                "Info": {
                    "type": "string"
                }
            }
        ],
        "data": [
            {
                "TID": 506964,
                "Name": "work_12",
                "Proto": "http",
                "State": "query",
                "Connection from": "127.0.0.1:36656",
                "ConnID": 2884,
                "This/prev job time, s": "236us",
                "CPU activity": "91.73%",
                "Jobs done": 3328,
                "Thread status": "working",
                "Info": "show_threads"
            }
        ],
        "total": 1,
        "error": "",
        "warning": ""
    }
]
Go
apiClient.UtilsAPI.Sql(context.Background()).Body("SHOW THREADS").Execute()
[
    {
        "columns": [
            {
                "TID": {
                    "type": "long"
                }
            },
            {
                "Name": {
                    "type": "string"
                }
            },
            {
                "Proto": {
                    "type": "string"
                }
            },
            {
                "State": {
                    "type": "string"
                }
            },
            {
                "Connection from": {
                    "type": "string"
                }
            },
            {
                "ConnID": {
                    "type": "long long"
                }
            },
            {
                "This/prev job time, s": {
                    "type": "string"
                }
            },
            {
                "CPU activity": {
                    "type": "float"
                }
            },
            {
                "Jobs done": {
                    "type": "long"
                }
            },
            {
                "Thread status": {
                    "type": "string"
                }
            },
            {
                "Info": {
                    "type": "string"
                }
            }
        ],
        "data": [
            {
                "TID": 506964,
                "Name": "work_12",
                "Proto": "http",
                "State": "query",
                "Connection from": "127.0.0.1:36656",
                "ConnID": 2884,
                "This/prev job time, s": "236us",
                "CPU activity": "91.73%",
                "Jobs done": 3328,
                "Thread status": "working",
                "Info": "show_threads"
            }
        ],
        "total": 1,
        "error": "",
        "warning": ""
    }
]

The Info column displays:

You can limit the maximum width of the Info column by specifying the columns=N option.

By default, queries are displayed in their original format. However, when the format=sphinxql option is used, queries will be shown in SQL format, regardless of the protocol used for execution.

Using format=all will show all threads, while idling and system threads are hidden without this option (e.g., those busy with OPTIMIZE).

SQL
SHOW THREADS OPTION columns=30\G
JSON
POST /cli -d "SHOW THREADS OPTION columns=30"
PHP
$client->nodes()->threads(['body'=>['columns'=>30]]);
Python
utilsApi.sql('SHOW THREADS OPTION columns=30')
javascript
res = await utilsApi.sql('SHOW THREADS OPTION columns=30');
Java
utilsApi.sql("SHOW THREADS OPTION columns=30");
C#
utilsApi.Sql("SHOW THREADS OPTION columns=30");
TypeScript
res = await utilsApi.sql('SHOW THREADS OPTION columns=30');
Go
apiClient.UtilsAPI.Sql(context.Background()).Body("SHOW THREADS OPTION columns=30").Execute()
¶ 19.4

SHOW QUERIES

SHOW QUERIES

SHOW QUERIES returns information about all currently running queries. The output is a table with the following structure:

SQL
mysql> SHOW QUERIES;
+------+--------------+---------+----------+-----------------+
| id   | query        | time    | protocol | host            |
+------+--------------+---------+----------+-----------------+
|  111 | select       | 5ms ago | http     | 127.0.0.1:58986 |
|   96 | SHOW QUERIES | 255us   | mysql    | 127.0.0.1:33616 |
+------+--------------+---------+----------+-----------------+
2 rows in set (0.61 sec)

Refer to SHOW THREADS if you'd like to gain insight from the perspective of the threads themselves.

¶ 19.5

SHOW VERSION

SHOW VERSION

SHOW VERSION provides detailed version information of various components of the Manticore Search instance. This command is particularly useful for administrators and developers who need to verify the version of Manticore Search they are running, along with the versions of its associated components.

The output table includes two columns:
- Component: This column names the specific component of Manticore Search.
- Version: This column displays the version information for the respective component.

SQL
mysql> SHOW VERSION;
+-----------+--------------------------------+
| Component | Version                        |
+-----------+--------------------------------+
| Daemon    | 6.2.13 61cfe38d2@24011520 dev  |
| Columnar  | columnar 2.2.5 214ce90@240115  |
| Secondary | secondary 2.2.5 214ce90@240115 |
| KNN       | knn 2.2.5 214ce90@240115       |
| Buddy     | buddy v2.0.11                  |
+-----------+--------------------------------+
¶ 19.6

KILL

KILL <query id>

KILL terminates the execution of a query by its ID, which you can find in SHOW QUERIES.

SQL
mysql> KILL 4;
Query OK, 1 row affected (0.00 sec)
¶ 19.7

SHOW WARNINGS

SHOW WARNINGS statement can be used to retrieve the warning produced by the latest query. The error message will be returned along with the query itself:

mysql> SELECT * FROM test1 WHERE MATCH('@@title hello') \G
ERROR 1064 (42000): index test1: syntax error, unexpected TOK_FIELDLIMIT
near '@title hello'

mysql> SELECT * FROM test1 WHERE MATCH('@title -hello') \G
ERROR 1064 (42000): index test1: query is non-computable (single NOT operator)

mysql> SELECT * FROM test1 WHERE MATCH('"test doc"/3') \G

*************************** 1\. row ***************************
        id: 4
    weight: 2500
  group_id: 2
date_added: 1231721236
1 row in set, 1 warning (0.00 sec)

mysql> SHOW WARNINGS \G

*************************** 1\. row ***************************
  Level: warning
   Code: 1000
Message: quorum threshold too high (words=2, thresh=3); replacing quorum operator
         with AND operator
1 row in set (0.00 sec)
¶ 19.8

SHOW VARIABLES

SHOW [{GLOBAL | SESSION}] VARIABLES LIKE 'pattern'

It returns the current values of a few server-wide variables. Also, support for GLOBAL and SESSION clauses was added.

mysql> SHOW GLOBAL VARIABLES;
+--------------------------+-----------+
| Variable_name            | Value     |
+--------------------------+-----------+
| autocommit               | 1         |
| collation_connection     | libc_ci   |
| query_log_format         | sphinxql  |
| log_level                | info      |
| max_allowed_packet       | 134217728 |
| character_set_client     | utf8      |
| character_set_connection | utf8      |
| grouping_in_utc          | 0         |
| last_insert_id           | 123, 200  |
+--------------------------+-----------+
9 rows in set (0.00 sec)
mysql> show variables like '%log%';
+------------------+----------+
| Variable_name    | Value    |
+------------------+----------+
| query_log_format | sphinxql |
| log_level        | info     |
+------------------+----------+
2 rows in set (0.00 sec)
mysql> show session variables like 'autocommit';
+---------------+-------+
| Variable_name | Value |
+---------------+-------+
| autocommit    | 0     |
+---------------+-------+
1 row in set (0.00 sec)
¶ 19.9

Profiling

¶ 19.9.1

Query profile

The SQL SHOW PROFILE statement and the "profile": true JSON interface option both provide a detailed execution profile of the executed query. In the case of SQL, profiling must be enabled in the current session before running the statement to be instrumented. This can be accomplished with the SET profiling=1 statement. By default, profiling is disabled to prevent potential performance implications, resulting in an empty profile if not enabled.

Each profiling result includes the following fields:

States in the profile are returned in a prerecorded order that roughly maps (but is not identical) to the actual query order.

The list of states may (and will) change over time as we refine the states. Here's a brief description of the currently profiled states.

SQL
SET profiling=1;

SELECT id FROM forum WHERE MATCH('the best') LIMIT 1;

SHOW PROFILE;
Query OK, 0 rows affected (0.00 sec)

+--------+
| id     |
+--------+
| 241629 |
+--------+
1 row in set (0.35 sec)

+--------------+----------+----------+---------+
| Status       | Duration | Switches | Percent |
+--------------+----------+----------+---------+
| unknown      | 0.000557 | 5        | 0.16    |
| net_read     | 0.000016 | 1        | 0.00    |
| local_search | 0.000076 | 1        | 0.02    |
| sql_parse    | 0.000121 | 1        | 0.03    |
| dict_setup   | 0.000003 | 1        | 0.00    |
| parse        | 0.000072 | 1        | 0.02    |
| transforms   | 0.000331 | 2        | 0.10    |
| init         | 0.001945 | 3        | 0.56    |
| read_docs    | 0.001257 | 76       | 0.36    |
| read_hits    | 0.002598 | 186      | 0.75    |
| get_docs     | 0.089328 | 2691     | 25.80   |
| get_hits     | 0.189626 | 2799     | 54.78   |
| filter       | 0.009369 | 2613     | 2.71    |
| rank         | 0.029669 | 7760     | 8.57    |
| sort         | 0.019070 | 2531     | 5.51    |
| finalize     | 0.000001 | 1        | 0.00    |
| clone_attrs  | 0.002009 | 1        | 0.58    |
| aggregate    | 0.000054 | 2        | 0.02    |
| net_write    | 0.000076 | 2        | 0.02    |
| eval_post    | 0.000001 | 1        | 0.00    |
| total        | 0.346179 | 18678    | 0       |
+--------------+----------+----------+---------+
21 rows in set (0.00 sec)
JSON
POST /search
{
  "index": "test",
  "profile": true,
  "query":
  {
    "match_phrase": { "_all" : "had grown quite" }
  }
}
 "profile": {
    "query": [
      {
        "status": "unknown",
        "duration": 0.000141,
        "switches": 8,
        "percent": 2.17
      },
      {
        "status": "local_df",
        "duration": 0.000870,
        "switches": 1,
        "percent": 13.40
      },
      {
        "status": "local_search",
        "duration": 0.001038,
        "switches": 2,
        "percent": 15.99
      },
      {
        "status": "setup_iter",
        "duration": 0.000154,
        "switches": 14,
        "percent": 2.37
      },
      {
        "status": "dict_setup",
        "duration": 0.000026,
        "switches": 3,
        "percent": 0.40
      },
      {
        "status": "parse",
        "duration": 0.000205,
        "switches": 3,
        "percent": 3.15
      },
      {
        "status": "transforms",
        "duration": 0.000974,
        "switches": 4,
        "percent": 15.01
      },
      {
        "status": "init",
        "duration": 0.002931,
        "switches": 20,
        "percent": 45.16
      },
      {
        "status": "get_docs",
        "duration": 0.000007,
        "switches": 7,
        "percent": 0.10
      },
      {
        "status": "rank",
        "duration": 0.000002,
        "switches": 14,
        "percent": 0.03
      },
      {
        "status": "finalize",
        "duration": 0.000013,
        "switches": 7,
        "percent": 0.20
      },
      {
        "status": "aggregate",
        "duration": 0.000128,
        "switches": 1,
        "percent": 1.97
      },
      {
        "status": "total",
        "duration": 0.006489,
        "switches": 84,
        "percent": 100.00
      }
    ]
  }
¶ 19.9.2

Query plan

The SHOW PLAN SQL statement and the "plan": N JSON interface option display the query execution plan. The plan is generated and stored during the actual execution, so in the case of SQL, profiling must be enabled in the current session before running that statement. This can be done with a SET profiling=1 statement.

Two items are returned in SQL mode:

To view the query execution plan in a JSON query, add "plan": N to the query. The result will appear as a plan property in the result set. N can be one of the following:

SQL
set profiling=1;

select * from hn_small where match('dog|cat') limit 0;

show plan;
*************************** 1. row ***************************
Variable: transformed_tree
   Value: OR(
  AND(KEYWORD(dog, querypos=1)),
  AND(KEYWORD(cat, querypos=2)))

*************************** 2. row ***************************
Variable: enabled_indexes
   Value:
2 rows in set (0.00 sec)
JSON
POST /search
{
  "index": "hn_small",
  "query": {"query_string": "dog|cat"},
  "_source": { "excludes":["*"] },
  "limit": 0,
  "plan": 3
}
{
  "took": 0,
  "timed_out": false,
  "hits": {
    "total": 4453,
    "total_relation": "eq",
    "hits": []
  },
  "plan": {
    "query": {
      "type": "OR",
      "description": "OR( AND(KEYWORD(dog, querypos=1)),  AND(KEYWORD(cat, querypos=2)))",
      "children": [
        {
          "type": "AND",
          "description": "AND(KEYWORD(dog, querypos=1))",
          "children": [
            {
              "type": "KEYWORD",
              "word": "dog",
              "querypos": 1
            }
          ]
        },
        {
          "type": "AND",
          "description": "AND(KEYWORD(cat, querypos=2))",
          "children": [
            {
              "type": "KEYWORD",
              "word": "cat",
              "querypos": 2
            }
          ]
        }
      ]
    }
  }
}

In some cases, the evaluated query tree can be quite different from the original one due to expansions and other transformations.

SQL
SET profiling=1;

SELECT id FROM forum WHERE MATCH('@title way* @content hey') LIMIT 1;

SHOW PLAN;
Query OK, 0 rows affected (0.00 sec)

+--------+
| id     |
+--------+
| 711651 |
+--------+
1 row in set (0.04 sec)

+------------------+-------------------------------------------------------------------------------------------------------------------------------------------------------------------------------------------------------------------------------------------------------------------------------------------------------------------------------------------------------------------------------------------------------------------------+
| Variable         | Value                                                                                                                                                                                                                                                                                                                                                                                                                   |
+------------------+-------------------------------------------------------------------------------------------------------------------------------------------------------------------------------------------------------------------------------------------------------------------------------------------------------------------------------------------------------------------------------------------------------------------------+
| transformed_tree | AND(
  OR(
    OR(
      AND(fields=(title), KEYWORD(wayne, querypos=1, expanded)),
      OR(
        AND(fields=(title), KEYWORD(ways, querypos=1, expanded)),
        AND(fields=(title), KEYWORD(wayyy, querypos=1, expanded)))),
    AND(fields=(title), KEYWORD(way, querypos=1, expanded)),
    OR(fields=(title), KEYWORD(way*, querypos=1, expanded))),
  AND(fields=(content), KEYWORD(hey, querypos=2))) |
+------------------+-------------------------------------------------------------------------------------------------------------------------------------------------------------------------------------------------------------------------------------------------------------------------------------------------------------------------------------------------------------------------------------------------------------------------+
1 row in set (0.00 sec)
JSON
POST /search
{
  "index": "forum",
  "query": {"query_string": "@title way* @content hey"},
  "_source": { "excludes":["*"] },
  "limit": 1,
  "plan": 3
}
{
  "took":33,
  "timed_out":false,
  "hits":
  {
    "total":105,
    "hits":
    [
       {
          "_id":"711651",
          "_score":2539,
          "_source":{}
       }
    ]
  },
  "plan":
  {
    "query":
    {
      "type":"AND",
      "description":"AND( OR( OR( AND(fields=(title), KEYWORD(wayne, querypos=1, expanded)),  OR( AND(fields=(title), KEYWORD(ways, querypos=1, expanded)),  AND(fields=(title), KEYWORD(wayyy, querypos=1, expanded)))),  AND(fields=(title), KEYWORD(way, querypos=1, expanded)),  OR(fields=(title), KEYWORD(way*, querypos=1, expanded))),  AND(fields=(content), KEYWORD(hey, querypos=2)))",
      "children":
      [
        {
          "type":"OR",
          "description":"OR( OR( AND(fields=(title), KEYWORD(wayne, querypos=1, expanded)),  OR( AND(fields=(title), KEYWORD(ways, querypos=1, expanded)),  AND(fields=(title), KEYWORD(wayyy, querypos=1, expanded)))),  AND(fields=(title), KEYWORD(way, querypos=1, expanded)),  OR(fields=(title), KEYWORD(way*, querypos=1, expanded)))",
          "children":
          [
            {
               "type":"OR",
               "description":"OR( AND(fields=(title), KEYWORD(wayne, querypos=1, expanded)),  OR( AND(fields=(title), KEYWORD(ways, querypos=1, expanded)),  AND(fields=(title), KEYWORD(wayyy, querypos=1, expanded))))",
               "children":
               [
                 {
                   "type":"AND",
                   "description":"AND(fields=(title), KEYWORD(wayne, querypos=1, expanded))",
                   "fields":["title"],
                   "max_field_pos":0,
                   "children":
                   [
                     {
                       "type":"KEYWORD",
                       "word":"wayne",
                       "querypos":1,
                       "expanded":true
                     }
                   ]
                 },
                 {
                   "type":"OR",
                   "description":"OR( AND(fields=(title), KEYWORD(ways, querypos=1, expanded)),  AND(fields=(title), KEYWORD(wayyy, querypos=1, expanded)))",
                   "children":
                   [
                     {
                       "type":"AND",
                       "description":"AND(fields=(title), KEYWORD(ways, querypos=1, expanded))",
                       "fields":["title"],
                       "max_field_pos":0,
                       "children":
                       [
                         {
                           "type":"KEYWORD",
                           "word":"ways",
                           "querypos":1,
                           "expanded":true
                         }
                       ]
                     },
                     {
                       "type":"AND",
                       "description":"AND(fields=(title), KEYWORD(wayyy, querypos=1, expanded))",
                       "fields":["title"],
                       "max_field_pos":0,
                       "children":
                       [
                         {
                           "type":"KEYWORD",
                           "word":"wayyy",
                           "querypos":1,
                           "expanded":true
                         }
                       ]
                     }
                   ]
                 }
               ]
            },
            {
              "type":"AND",
              "description":"AND(fields=(title), KEYWORD(way, querypos=1, expanded))",
              "fields":["title"],
              "max_field_pos":0,
              "children":
              [
                 {
                    "type":"KEYWORD",
                    "word":"way",
                    "querypos":1,
                    "expanded":true
                 }
              ]
            },
            {
              "type":"OR",
              "description":"OR(fields=(title), KEYWORD(way*, querypos=1, expanded))",
              "fields":["title"],
              "max_field_pos":0,
              "children":
              [
                {
                  "type":"KEYWORD",
                  "word":"way*",
                  "querypos":1,
                  "expanded":true
                }
              ]
            }
          ]
        },
        {
          "type":"AND",
          "description":"AND(fields=(content), KEYWORD(hey, querypos=2))",
          "fields":["content"],
          "max_field_pos":0,
          "children":
          [
            {
              "type":"KEYWORD",
              "word":"hey",
              "querypos":2
            }
          ]
        }
      ]
    }
  }
}
JSON
POST /search
{
  "index": "forum",
  "query": {"query_string": "@title way* @content hey"},
  "_source": { "excludes":["*"] },
  "limit": 1,
  "plan": 2
}
{
  "took": 33,
  "timed_out": false,
  "hits": {
    "total": 105,
    "hits": [
      {
        "_id": "711651",
        "_score": 2539,
        "_source": {}
      }
    ]
  },
  "plan": {
    "query": {
      "type": "AND",
      "children": [
        {
          "type": "OR",
          "children": [
            {
              "type": "OR",
              "children": [
                {
                  "type": "AND",
                  "fields": [
                    "title"
                  ],
                  "max_field_pos": 0,
                  "children": [
                    {
                      "type": "KEYWORD",
                      "word": "wayne",
                      "querypos": 1,
                      "expanded": true
                    }
                  ]
                },
                {
                  "type": "OR",
                  "children": [
                    {
                      "type": "AND",
                      "fields": [
                        "title"
                      ],
                      "max_field_pos": 0,
                      "children": [
                        {
                          "type": "KEYWORD",
                          "word": "ways",
                          "querypos": 1,
                          "expanded": true
                        }
                      ]
                    },
                    {
                      "type": "AND",
                      "fields": [
                        "title"
                      ],
                      "max_field_pos": 0,
                      "children": [
                        {
                          "type": "KEYWORD",
                          "word": "wayyy",
                          "querypos": 1,
                          "expanded": true
                        }
                      ]
                    }
                  ]
                }
              ]
            },
            {
              "type": "AND",
              "fields": [
                "title"
              ],
              "max_field_pos": 0,
              "children": [
                {
                  "type": "KEYWORD",
                  "word": "way",
                  "querypos": 1,
                  "expanded": true
                }
              ]
            },
            {
              "type": "OR",
              "fields": [
                "title"
              ],
              "max_field_pos": 0,
              "children": [
                {
                  "type": "KEYWORD",
                  "word": "way*",
                  "querypos": 1,
                  "expanded": true
                }
              ]
            }
          ]
        },
        {
          "type": "AND",
          "fields": [
            "content"
          ],
          "max_field_pos": 0,
          "children": [
            {
              "type": "KEYWORD",
              "word": "hey",
              "querypos": 2
            }
          ]
        }
      ]
    }
  }
}
JSON
POST /search
{
  "index": "forum",
  "query": {"query_string": "@title way* @content hey"},
  "_source": { "excludes":["*"] },
  "limit": 1,
  "plan": 1
}
{
  "took":33,
  "timed_out":false,
  "hits":
  {
    "total":105,
    "hits":
    [
       {
          "_id":"711651",
          "_score":2539,
          "_source":{}
       }
    ]
  },
  "plan":
  {
    "query":
    {
      "description":"AND( OR( OR( AND(fields=(title), KEYWORD(wayne, querypos=1, expanded)),  OR( AND(fields=(title), KEYWORD(ways, querypos=1, expanded)),  AND(fields=(title), KEYWORD(wayyy, querypos=1, expanded)))),  AND(fields=(title), KEYWORD(way, querypos=1, expanded)),  OR(fields=(title), KEYWORD(way*, querypos=1, expanded))),  AND(fields=(content), KEYWORD(hey, querypos=2)))"
    }
  }
}

See also EXPLAIN QUERY. It displays the execution tree of a full-text query without actually executing the query. Note that when using SHOW PLAN after a query to a real-time table, the result will be based on a random disk/RAM chunk. Therefore, if you have recently modified the table's tokenization settings, or if the chunks vary significantly in terms of dictionaries, etc., you might not get the result you are expecting. Take this into account and consider using EXPLAIN QUERY as well.

JSON result set notes

query property contains the transformed full-text query tree. Each node contains:

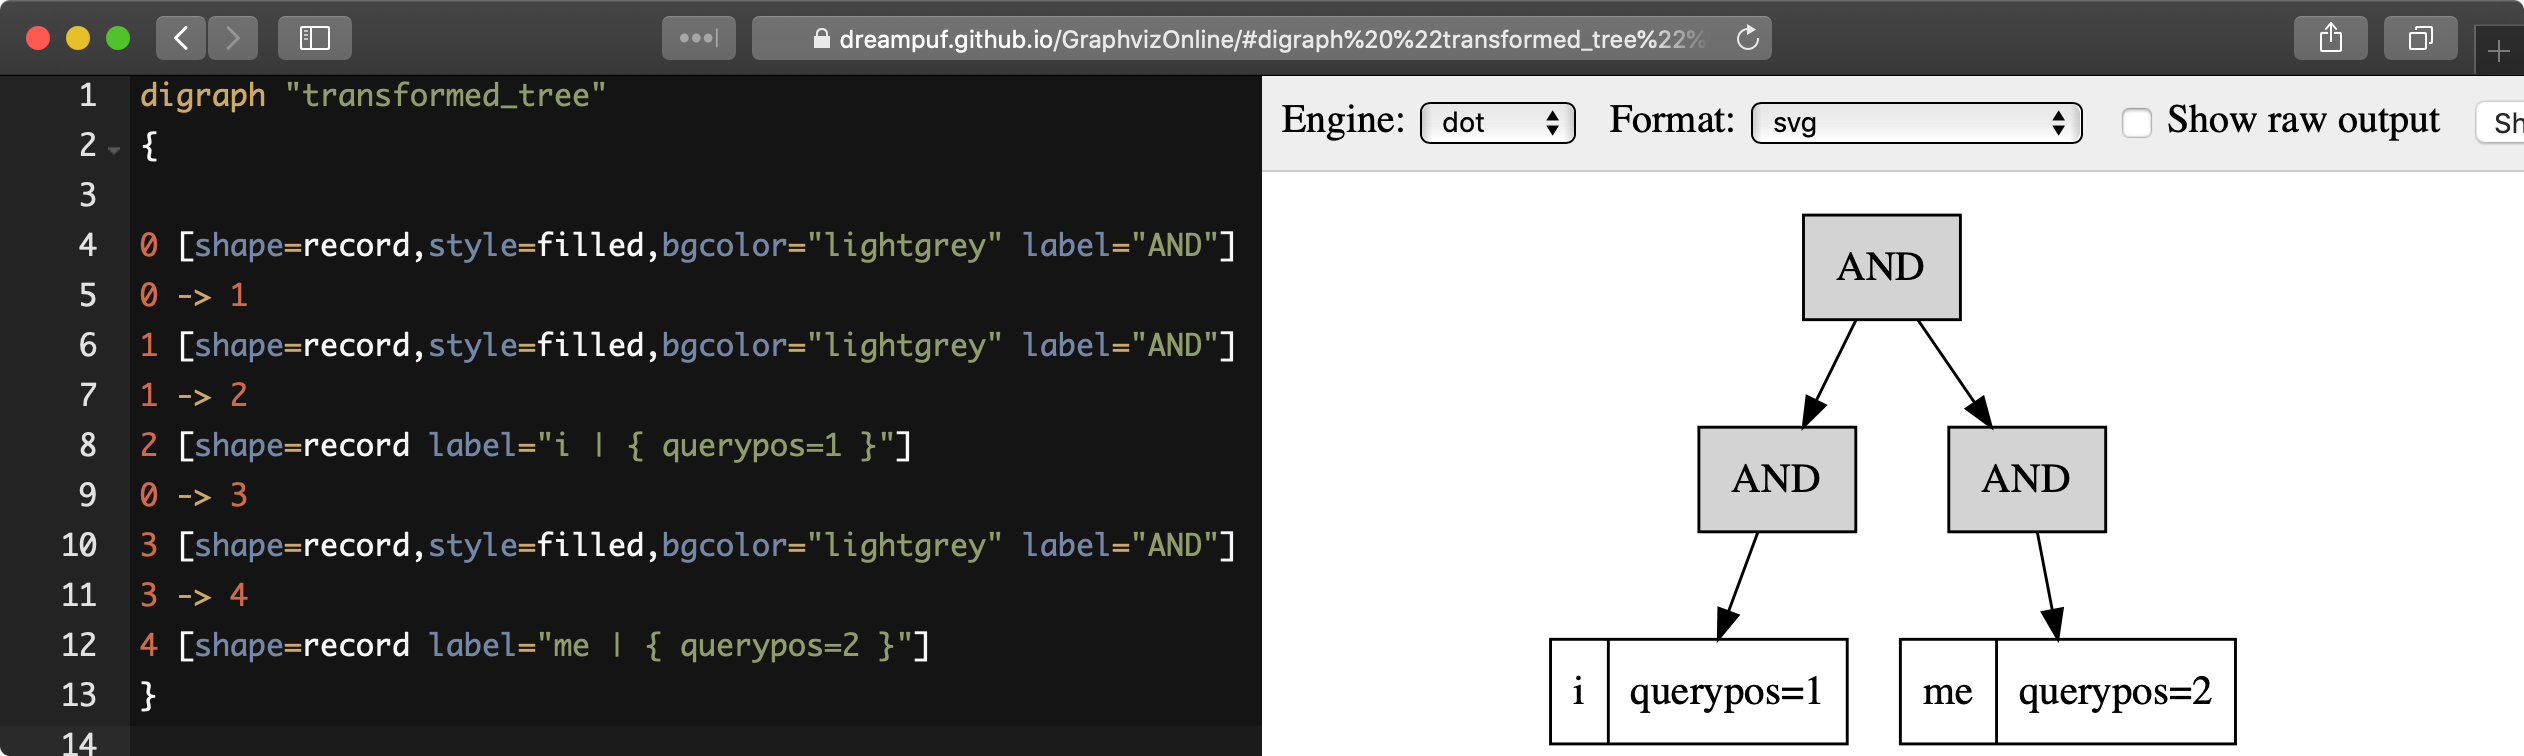
Dot format for SHOW PLAN

SHOW PLAN format=dot allows returning the full-text query execution tree in a hierarchical format suitable for visualization by existing tools, such as https://dreampuf.github.io/GraphvizOnline:

MySQL [(none)]> show plan option format=dot\G

*************************** 1. row ***************************
Variable: transformed_tree
   Value: digraph "transformed_tree"
{

0 [shape=record,style=filled,bgcolor="lightgrey" label="AND"]
0 -> 1
1 [shape=record,style=filled,bgcolor="lightgrey" label="AND"]
1 -> 2
2 [shape=record label="i | { querypos=1 }"]
0 -> 3
3 [shape=record,style=filled,bgcolor="lightgrey" label="AND"]
3 -> 4
4 [shape=record label="me | { querypos=2 }"]
}

SHOW PLAN graphviz example

¶ 19.10

Table settings and status

¶ 19.10.1

SHOW TABLE STATUS

SHOW TABLE STATUS is an SQL statement that displays various per-table statistics.

The syntax is:

SHOW TABLE index_name STATUS

Depending on index type, displayed statistic includes different set of rows:

Here is the meaning of these values:

SQL
mysql> SHOW TABLE statistic STATUS;
+-----------------------------+--------------------------------------------------------------------------+
| Variable_name               | Value                                                                    |
+-----------------------------+--------------------------------------------------------------------------+
| index_type                  | rt                                                                       |
| indexed_documents           | 146000                                                                   |
| indexed_bytes               | 149504000                                                                |
| ram_bytes                   | 87674788                                                                 |
| disk_bytes                  | 1762811                                                                  |
| disk_mapped                 | 794147                                                                   |
| disk_mapped_cached          | 802816                                                                   |
| disk_mapped_doclists        | 0                                                                        |
| disk_mapped_cached_doclists | 0                                                                        |
| disk_mapped_hitlists        | 0                                                                        |
| disk_mapped_cached_hitlists | 0                                                                        |
| killed_documents            | 0                                                                        |
| killed_rate                 | 0.00%                                                                    |
| ram_chunk                   | 86865484                                                                 |
| ram_chunk_segments_count    | 24                                                                       |
| disk_chunks                 | 1                                                                        |
| mem_limit                   | 134217728                                                                |
| mem_limit_rate              | 95.00%                                                                   |
| ram_bytes_retired           | 0                                                                        |
| locked                      | 0                                                                        |
| tid                         | 0                                                                        |
| tid_saved                   | 0                                                                        |
| query_time_1min             | {"queries":0, "avg":"-", "min":"-", "max":"-", "pct95":"-", "pct99":"-"} |
| query_time_5min             | {"queries":0, "avg":"-", "min":"-", "max":"-", "pct95":"-", "pct99":"-"} |
| query_time_15min            | {"queries":0, "avg":"-", "min":"-", "max":"-", "pct95":"-", "pct99":"-"} |
| query_time_total            | {"queries":0, "avg":"-", "min":"-", "max":"-", "pct95":"-", "pct99":"-"} |
| found_rows_1min             | {"queries":0, "avg":"-", "min":"-", "max":"-", "pct95":"-", "pct99":"-"} |
| found_rows_5min             | {"queries":0, "avg":"-", "min":"-", "max":"-", "pct95":"-", "pct99":"-"} |
| found_rows_15min            | {"queries":0, "avg":"-", "min":"-", "max":"-", "pct95":"-", "pct99":"-"} |
| found_rows_total            | {"queries":0, "avg":"-", "min":"-", "max":"-", "pct95":"-", "pct99":"-"} |
+-----------------------------+--------------------------------------------------------------------------+
29 rows in set (0.00 sec)
PHP
$index->status();
Array(
    [index_type] => rt
    [indexed_documents] => 3
    [indexed_bytes] => 0
    [ram_bytes] => 6678
    [disk_bytes] => 611
    [ram_chunk] => 990
    [ram_chunk_segments_count] => 2
    [mem_limit] => 134217728
    [ram_bytes_retired] => 0
    [locked] => 0
    [tid] => 15
    [query_time_1min] => {"queries":1, "avg_sec":0.001, "min_sec":0.001, "max_sec":0.001, "pct95_sec":0.001, "pct99_sec":0.001}
    [query_time_5min] => {"queries":1, "avg_sec":0.001, "min_sec":0.001, "max_sec":0.001, "pct95_sec":0.001, "pct99_sec":0.001}
    [query_time_15min] => {"queries":1, "avg_sec":0.001, "min_sec":0.001, "max_sec":0.001, "pct95_sec":0.001, "pct99_sec":0.001}
    [query_time_total] => {"queries":1, "avg_sec":0.001, "min_sec":0.001, "max_sec":0.001, "pct95_sec":0.001, "pct99_sec":0.001}
    [found_rows_1min] => {"queries":1, "avg":3, "min":3, "max":3, "pct95":3, "pct99":3}
    [found_rows_5min] => {"queries":1, "avg":3, "min":3, "max":3, "pct95":3, "pct99":3}
    [found_rows_15min] => {"queries":1, "avg":3, "min":3, "max":3, "pct95":3, "pct99":3}
    [found_rows_total] => {"queries":1, "avg":3, "min":3, "max":3, "pct95":3, "pct99":3}

)
Python
utilsApi.sql('SHOW TABLE statistic STATUS')
{u'columns': [{u'Key': {u'type': u'string'}},
              {u'Value': {u'type': u'string'}}],
 u'data': [
   {u'Key': u'index_type', u'Value': u'rt'}
    {u'Key': u'indexed_documents', u'Value': u'3'}
    {u'Key': u'indexed_bytes', u'Value': u'0'}
    {u'Key': u'ram_bytes', u'Value': u'6678'}
    {u'Key': u'disk_bytes', u'Value': u'611'}
    {u'Key': u'ram_chunk', u'Value': u'990'}
    {u'Key': u'ram_chunk_segments_count', u'Value': u'2'}
    {u'Key': u'mem_limit', u'Value': u'134217728'}
    {u'Key': u'ram_bytes_retired', u'Value': u'0'}
    {u'Key': u'locked', u'Value': u'0'}
    {u'Key': u'tid', u'Value': u'15'}
    {u'Key': u'query_time_1min', u'Value': u'{"queries":1, "avg_sec":0.001, "min_sec":0.001, "max_sec":0.001, "pct95_sec":0.001, "pct99_sec":0.001}'}
    {u'Key': u'query_time_5min', u'Value': u'{"queries":1, "avg_sec":0.001, "min_sec":0.001, "max_sec":0.001, "pct95_sec":0.001, "pct99_sec":0.001}'}
    {u'Key': u'query_time_15min', u'Value': u'{"queries":1, "avg_sec":0.001, "min_sec":0.001, "max_sec":0.001, "pct95_sec":0.001, "pct99_sec":0.001}'}
    {u'Key': u'query_time_total', u'Value': u'{"queries":1, "avg_sec":0.001, "min_sec":0.001, "max_sec":0.001, "pct95_sec":0.001, "pct99_sec":0.001}'}
    {u'Key': u'found_rows_1min', u'Value': u'{"queries":1, "avg":3, "min":3, "max":3, "pct95":3, "pct99":3}'}
    {u'Key': u'found_rows_5min', u'Value': u'{"queries":1, "avg":3, "min":3, "max":3, "pct95":3, "pct99":3}'}
    {u'Key': u'found_rows_15min', u'Value': u'{"queries":1, "avg":3, "min":3, "max":3, "pct95":3, "pct99":3}'}
    {u'Key': u'found_rows_total', u'Value': u'{"queries":1, "avg":3, "min":3, "max":3, "pct95":3, "pct99":3}'}],
 u'error': u'',
 u'total': 0,
 u'warning': u''}
Javascript
res = await utilsApi.sql('SHOW TABLE statistic STATUS');
{"columns": [{"Key": {"type": "string"}},
              {"Value": {"type": "string"}}],
 "data": [
   {"Key": "index_type", "Value": "rt"}
    {"Key": "indexed_documents", "Value": "3"}
    {"Key": "indexed_bytes", "Value": "0"}
    {"Key": "ram_bytes", "Value": "6678"}
    {"Key": "disk_bytes", "Value": "611"}
    {"Key": "ram_chunk", "Value": "990"}
    {"Key": "ram_chunk_segments_count", "Value": "2"}
    {"Key": "mem_limit", "Value": "134217728"}
    {"Key": "ram_bytes_retired", "Value": "0"}
    {"Key": "locked", "Value": "0"}
    {"Key": "tid", "Value": "15"}
    {"Key": "query_time_1min", "Value": "{"queries":1, "avg_sec":0.001, "min_sec":0.001, "max_sec":0.001, "pct95_sec":0.001, "pct99_sec":0.001}"}
    {"Key": "query_time_5min", "Value": "{"queries":1, "avg_sec":0.001, "min_sec":0.001, "max_sec":0.001, "pct95_sec":0.001, "pct99_sec":0.001}"}
    {"Key": "query_time_15min", "Value": "{"queries":1, "avg_sec":0.001, "min_sec":0.001, "max_sec":0.001, "pct95_sec":0.001, "pct99_sec":0.001}"}
    {"Key": "query_time_total", "Value": "{"queries":1, "avg_sec":0.001, "min_sec":0.001, "max_sec":0.001, "pct95_sec":0.001, "pct99_sec":0.001}"}
    {"Key": "found_rows_1min", "Value": "{"queries":1, "avg":3, "min":3, "max":3, "pct95":3, "pct99":3}"}
    {"Key": "found_rows_5min", "Value": "{"queries":1, "avg":3, "min":3, "max":3, "pct95":3, "pct99":3}"}
    {"Key": "found_rows_15min", "Value": "{"queries":1, "avg":3, "min":3, "max":3, "pct95":3, "pct99":3}"}
    {"Key": "found_rows_total", "Value": "{"queries":1, "avg":3, "min":3, "max":3, "pct95":3, "pct99":3}"}],
 "error": "",
 "total": 0,
 "warning": ""}
Java
utilsApi.sql("SHOW TABLE statistic STATUS");
{columns=[{ Key : { type=string }},
              { Value : { type=string }}],
  data : [
   { Key=index_type, Value=rt}
    { Key=indexed_documents, Value=3}
    { Key=indexed_bytes, Value=0}
    { Key=ram_bytes, Value=6678}
    { Key=disk_bytes, Value=611}
    { Key=ram_chunk, Value=990}
    { Key=ram_chunk_segments_count, Value=2}
    { Key=mem_limit, Value=134217728}
    { Key=ram_bytes_retired, Value=0}
    { Key=locked, Value=0}
    { Key=tid, Value=15}
    { Key=query_time_1min, Value={queries:1, avg_sec:0.001, min_sec:0.001, max_sec:0.001, pct95_sec:0.001, pct99_sec:0.001}}
    { Key=query_time_5min, Value={queries:1, avg_sec:0.001, min_sec:0.001, max_sec:0.001, pct95_sec:0.001, pct99_sec:0.001}}
    { Key=query_time_15min, Value={queries:1, avg_sec:0.001, min_sec:0.001, max_sec:0.001, pct95_sec:0.001, pct99_sec:0.001}}
    { Key=query_time_total, Value={queries:1, avg_sec:0.001, min_sec:0.001, max_sec:0.001, pct95_sec:0.001, pct99_sec:0.001}}
    { Key=found_rows_1min, Value={queries:1, avg:3, min:3, max:3, pct95:3, pct99:3}}
    { Key=found_rows_5min, Value={queries:1, avg:3, min:3, max:3, pct95:3, pct99:3}}
    { Key=found_rows_15min, Value={queries:1, avg:3, min:3, max:3, pct95:3, pct99:3}}
    { Key=found_rows_total, Value={queries:1, avg:3, min:3, max:3, pct95:3, pct99:3}}],
  error= ,
  total=0,
  warning= }
C#
utilsApi.Sql("SHOW TABLE statistic STATUS");
{columns=[{ Key : { type=string }},
              { Value : { type=string }}],
  data : [
   { Key=index_type, Value=rt}
    { Key=indexed_documents, Value=3}
    { Key=indexed_bytes, Value=0}
    { Key=ram_bytes, Value=6678}
    { Key=disk_bytes, Value=611}
    { Key=ram_chunk, Value=990}
    { Key=ram_chunk_segments_count, Value=2}
    { Key=mem_limit, Value=134217728}
    { Key=ram_bytes_retired, Value=0}
    { Key=locked, Value=0}
    { Key=tid, Value=15}
    { Key=query_time_1min, Value={queries:1, avg_sec:0.001, min_sec:0.001, max_sec:0.001, pct95_sec:0.001, pct99_sec:0.001}}
    { Key=query_time_5min, Value={queries:1, avg_sec:0.001, min_sec:0.001, max_sec:0.001, pct95_sec:0.001, pct99_sec:0.001}}
    { Key=query_time_15min, Value={queries:1, avg_sec:0.001, min_sec:0.001, max_sec:0.001, pct95_sec:0.001, pct99_sec:0.001}}
    { Key=query_time_total, Value={queries:1, avg_sec:0.001, min_sec:0.001, max_sec:0.001, pct95_sec:0.001, pct99_sec:0.001}}
    { Key=found_rows_1min, Value={queries:1, avg:3, min:3, max:3, pct95:3, pct99:3}}
    { Key=found_rows_5min, Value={queries:1, avg:3, min:3, max:3, pct95:3, pct99:3}}
    { Key=found_rows_15min, Value={queries:1, avg:3, min:3, max:3, pct95:3, pct99:3}}
    { Key=found_rows_total, Value={queries:1, avg:3, min:3, max:3, pct95:3, pct99:3}}],
  error="" ,
  total=0,
  warning="" }
TypeScript
res = await utilsApi.sql('SHOW TABLE statistic STATUS');
{
    "columns": 
    [{
        "Key": {"type": "string"}
    },
    {
        "Value": {"type": "string"}
    }],
    "data": 
    [
        {"Key": "index_type", "Value": "rt"}
        {"Key": "indexed_documents", "Value": "3"}
        {"Key": "indexed_bytes", "Value": "0"}
        {"Key": "ram_bytes", "Value": "6678"}
        {"Key": "disk_bytes", "Value": "611"}
        {"Key": "ram_chunk", "Value": "990"}
        {"Key": "ram_chunk_segments_count", "Value": "2"}
        {"Key": "mem_limit", "Value": "134217728"}
        {"Key": "ram_bytes_retired", "Value": "0"}
        {"Key": "locked", "Value": "0"}
        {"Key": "tid", "Value": "15"}
        {"Key": "query_time_1min", "Value": "{"queries":1, "avg_sec":0.001, "min_sec":0.001, "max_sec":0.001, "pct95_sec":0.001, "pct99_sec":0.001}"}
        {"Key": "query_time_5min", "Value": "{"queries":1, "avg_sec":0.001, "min_sec":0.001, "max_sec":0.001, "pct95_sec":0.001, "pct99_sec":0.001}"}
        {"Key": "query_time_15min", "Value": "{"queries":1, "avg_sec":0.001, "min_sec":0.001, "max_sec":0.001, "pct95_sec":0.001, "pct99_sec":0.001}"}
        {"Key": "query_time_total", "Value": "{"queries":1, "avg_sec":0.001, "min_sec":0.001, "max_sec":0.001, "pct95_sec":0.001, "pct99_sec":0.001}"}
        {"Key": "found_rows_1min", "Value": "{"queries":1, "avg":3, "min":3, "max":3, "pct95":3, "pct99":3}"}
        {"Key": "found_rows_5min", "Value": "{"queries":1, "avg":3, "min":3, "max":3, "pct95":3, "pct99":3}"}
        {"Key": "found_rows_15min", "Value": "{"queries":1, "avg":3, "min":3, "max":3, "pct95":3, "pct99":3}"}
        {"Key": "found_rows_total", "Value": "{"queries":1, "avg":3, "min":3, "max":3, "pct95":3, "pct99":3}"}
    ],
    "error": "",
    "total": 0,
    "warning": ""
}
Go
apiClient.UtilsAPI.Sql(context.Background()).Body("SHOW TABLE statistic STATUS").Execute()
{
    "columns": 
    [{
        "Key": {"type": "string"}
    },
    {
        "Value": {"type": "string"}
    }],
    "data": 
    [
        {"Key": "index_type", "Value": "rt"}
        {"Key": "indexed_documents", "Value": "3"}
        {"Key": "indexed_bytes", "Value": "0"}
        {"Key": "ram_bytes", "Value": "6678"}
        {"Key": "disk_bytes", "Value": "611"}
        {"Key": "ram_chunk", "Value": "990"}
        {"Key": "ram_chunk_segments_count", "Value": "2"}
        {"Key": "mem_limit", "Value": "134217728"}
        {"Key": "ram_bytes_retired", "Value": "0"}
        {"Key": "locked", "Value": "0"}
        {"Key": "tid", "Value": "15"}
        {"Key": "query_time_1min", "Value": "{"queries":1, "avg_sec":0.001, "min_sec":0.001, "max_sec":0.001, "pct95_sec":0.001, "pct99_sec":0.001}"}
        {"Key": "query_time_5min", "Value": "{"queries":1, "avg_sec":0.001, "min_sec":0.001, "max_sec":0.001, "pct95_sec":0.001, "pct99_sec":0.001}"}
        {"Key": "query_time_15min", "Value": "{"queries":1, "avg_sec":0.001, "min_sec":0.001, "max_sec":0.001, "pct95_sec":0.001, "pct99_sec":0.001}"}
        {"Key": "query_time_total", "Value": "{"queries":1, "avg_sec":0.001, "min_sec":0.001, "max_sec":0.001, "pct95_sec":0.001, "pct99_sec":0.001}"}
        {"Key": "found_rows_1min", "Value": "{"queries":1, "avg":3, "min":3, "max":3, "pct95":3, "pct99":3}"}
        {"Key": "found_rows_5min", "Value": "{"queries":1, "avg":3, "min":3, "max":3, "pct95":3, "pct99":3}"}
        {"Key": "found_rows_15min", "Value": "{"queries":1, "avg":3, "min":3, "max":3, "pct95":3, "pct99":3}"}
        {"Key": "found_rows_total", "Value": "{"queries":1, "avg":3, "min":3, "max":3, "pct95":3, "pct99":3}"}
    ],
    "error": "",
    "total": 0,
    "warning": ""
}
¶ 19.10.2

SHOW TABLE SETTINGS

SHOW TABLE SETTINGS is an SQL statement that displays per-table settings in a format compatible with the config file.

The syntax is:

SHOW TABLE index_name[.N | CHUNK N] SETTINGS

The output resembles the --dumpconfig option of the indextool utility. The report provides a breakdown of all table settings, including tokenizer and dictionary options.

SQL
SHOW TABLE forum SETTINGS;
+---------------+-----------------------------------------------------------------------------------------------------------+
| Variable_name | Value                                                                                                     |
+---------------+-----------------------------------------------------------------------------------------------------------+
| settings      | min_prefix_len = 3
charset_table = 0..9, A..Z->a..z, _, -, a..z, U+410..U+42F->U+430..U+44F, U+430..U+44F |
+---------------+-----------------------------------------------------------------------------------------------------------+
1 row in set (0.00 sec)

You can also specify a particular chunk number to view the settings of a specific chunk in an RT table. The numbering is 0-based.

SQL
SHOW TABLE forum CHUNK 0 SETTINGS;
+---------------+-----------------------------------------------------------------------------------------------------------+
| Variable_name | Value                                                                                                     |
+---------------+-----------------------------------------------------------------------------------------------------------+
| settings      | min_prefix_len = 3
charset_table = 0..9, A..Z->a..z, _, -, a..z, U+410..U+42F->U+430..U+44F, U+430..U+44F |
+---------------+-----------------------------------------------------------------------------------------------------------+
1 row in set (0.00 sec)